Open Access
Fig. 3.
Download original image
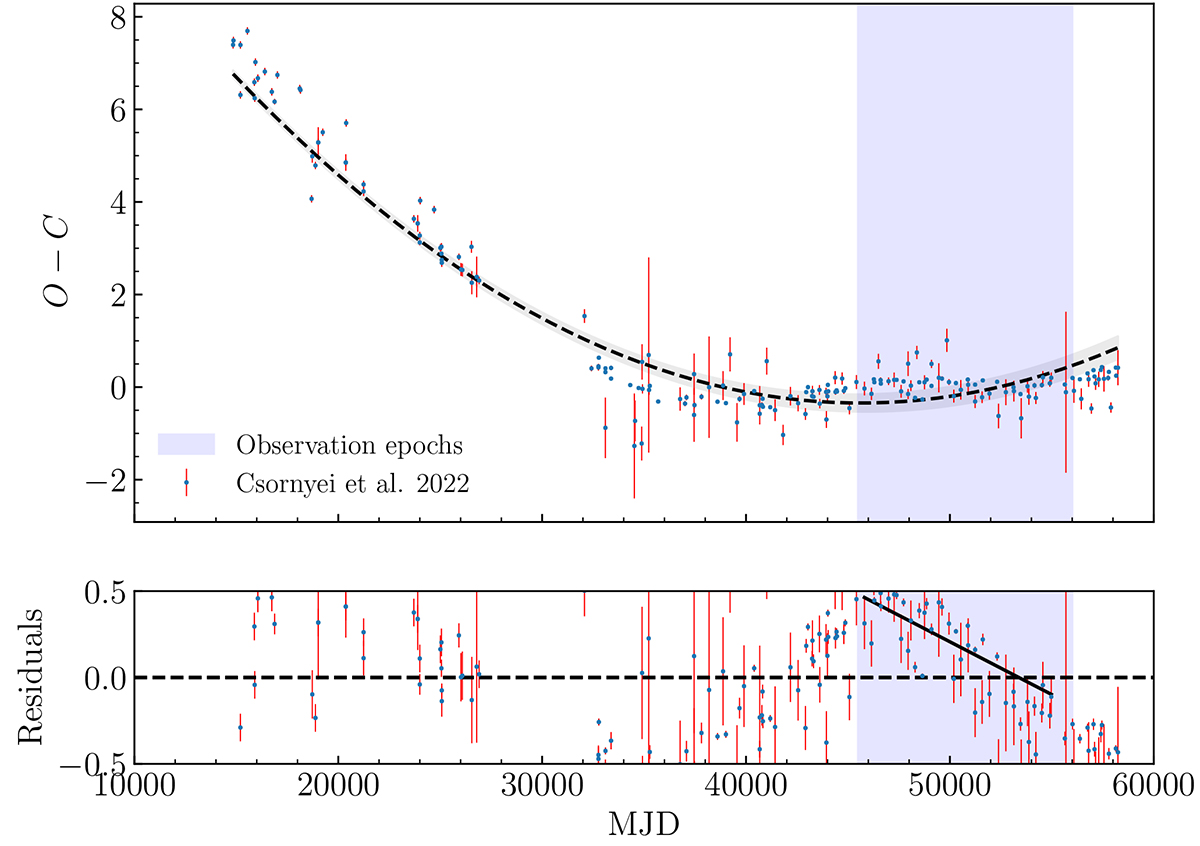
O − C diagram of Y Oph. O − C calculations were performed by Csörnyei et al. (2022). The dashed line is a parabola fit over the entire range of data. The continuous line on the bottom plot is the linear fit of the O − C residuals over the observation period used in this paper.
Current usage metrics show cumulative count of Article Views (full-text article views including HTML views, PDF and ePub downloads, according to the available data) and Abstracts Views on Vision4Press platform.
Data correspond to usage on the plateform after 2015. The current usage metrics is available 48-96 hours after online publication and is updated daily on week days.
Initial download of the metrics may take a while.