Fig. 2.
Download original image
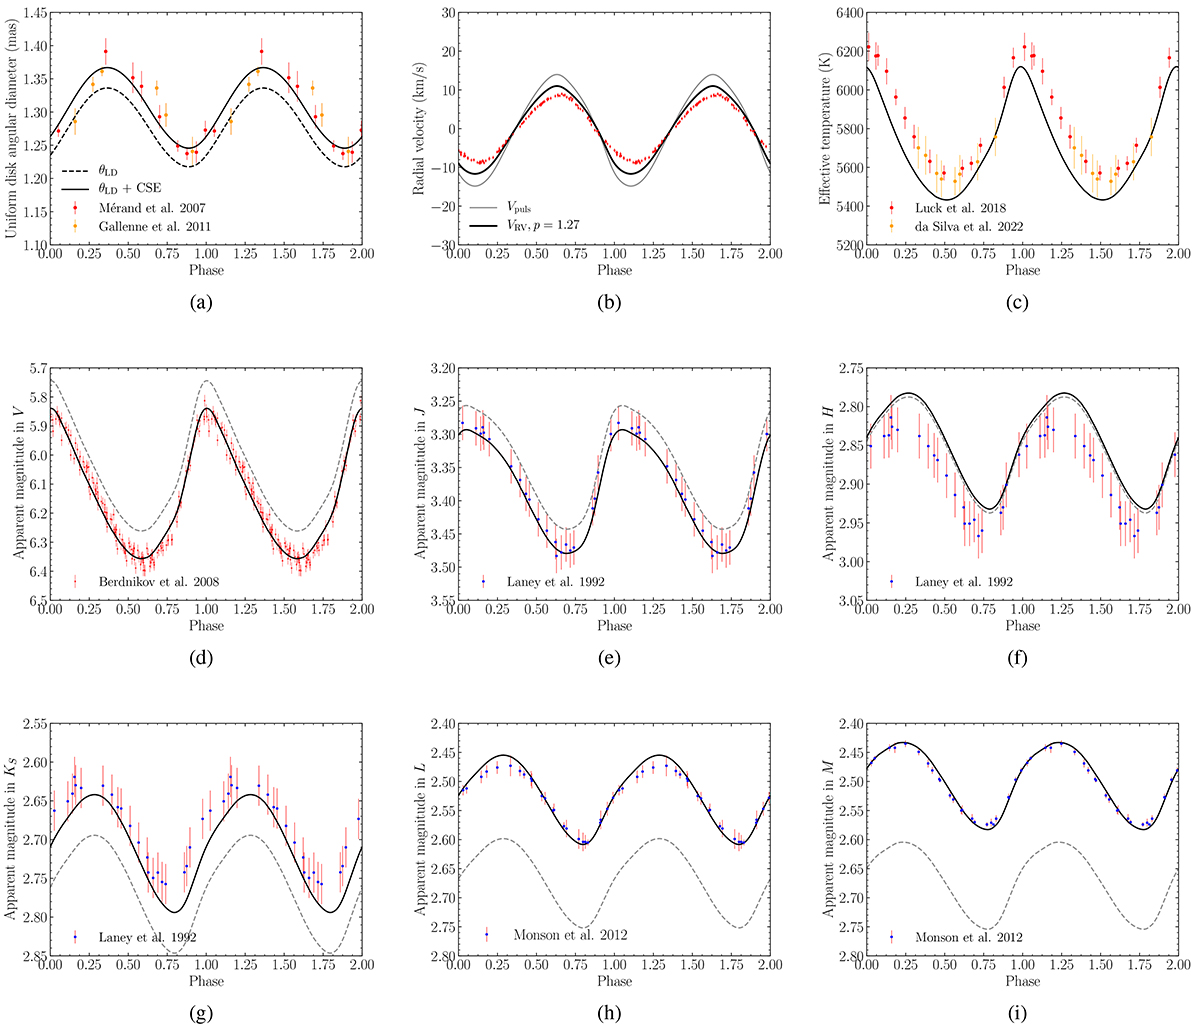
Best result for the non-linear analysis with RSP/MESA for 8 M⊙ model. Uniform disk angular diameter, radial velocity curve, and effective temperature are displayed in (a), (b), and (c), respectively. The photometric panels indicate the apparent magnitudes in (d) V-band, (e) J-band, (f) H-band, (g) KS-band, (h) L-band, and (i) M-band. In the angular diameter and photometric panels, the thick black line and dashed grey lines are the RSP models, with and without the CSE models, respectively.
Current usage metrics show cumulative count of Article Views (full-text article views including HTML views, PDF and ePub downloads, according to the available data) and Abstracts Views on Vision4Press platform.
Data correspond to usage on the plateform after 2015. The current usage metrics is available 48-96 hours after online publication and is updated daily on week days.
Initial download of the metrics may take a while.