Fig. 5
Download original image
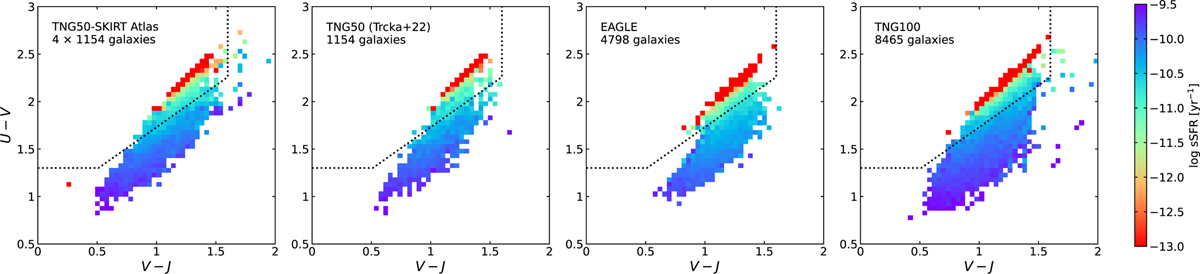
The UVJ plane of the TNG50, EAGLE, and TNG100 cosmological hydrodynamical simulations. Each panel contains only galaxies at z = 0 within the same stellar mass range (1098 M⊙ < M⋆ < 1012 M⊙). All colours are calculated from SKIRT-generated fluxes or images that take dust attenuation into account. The colour scale represents the median sSFR of all galaxies with UVJ colours within each pixel. The dotted line in each panel indicates the separation between the quiescent and star-forming galaxy populations and is taken from Donnari et al. (2019).
Current usage metrics show cumulative count of Article Views (full-text article views including HTML views, PDF and ePub downloads, according to the available data) and Abstracts Views on Vision4Press platform.
Data correspond to usage on the plateform after 2015. The current usage metrics is available 48-96 hours after online publication and is updated daily on week days.
Initial download of the metrics may take a while.