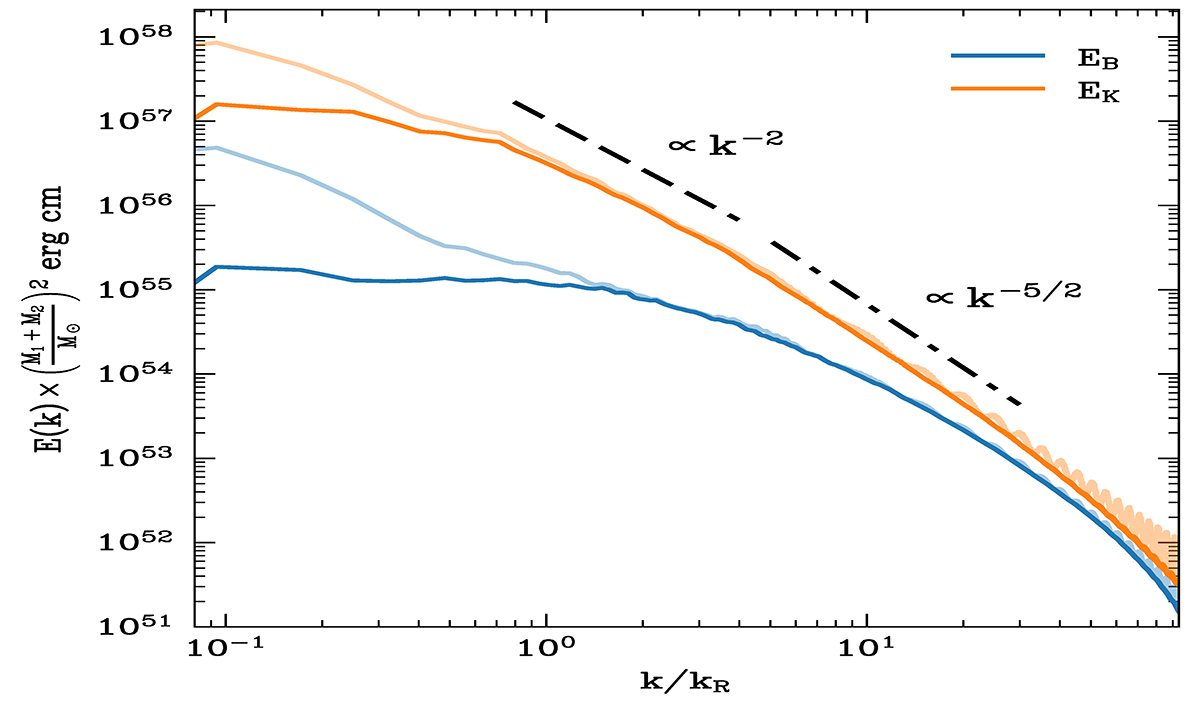
Fig. 8.
Download original image
Kinetic and magnetic horizontally integrated energy spectra during the saturation phase obtained with ℓmax = 128 for simulation run B. Opaque lines represent the spectra excluding ℓ = 0 components, while transparent lines include them. The oscillations visible at high k/kR when including ℓ = 0 components result from the our direct integration of Eq. (A.5) which involves spherical Bessel functions jℓ(kr) that are very oscillatory for kr ≫ ℓ.
Current usage metrics show cumulative count of Article Views (full-text article views including HTML views, PDF and ePub downloads, according to the available data) and Abstracts Views on Vision4Press platform.
Data correspond to usage on the plateform after 2015. The current usage metrics is available 48-96 hours after online publication and is updated daily on week days.
Initial download of the metrics may take a while.