Open Access
Fig. 2.
Download original image
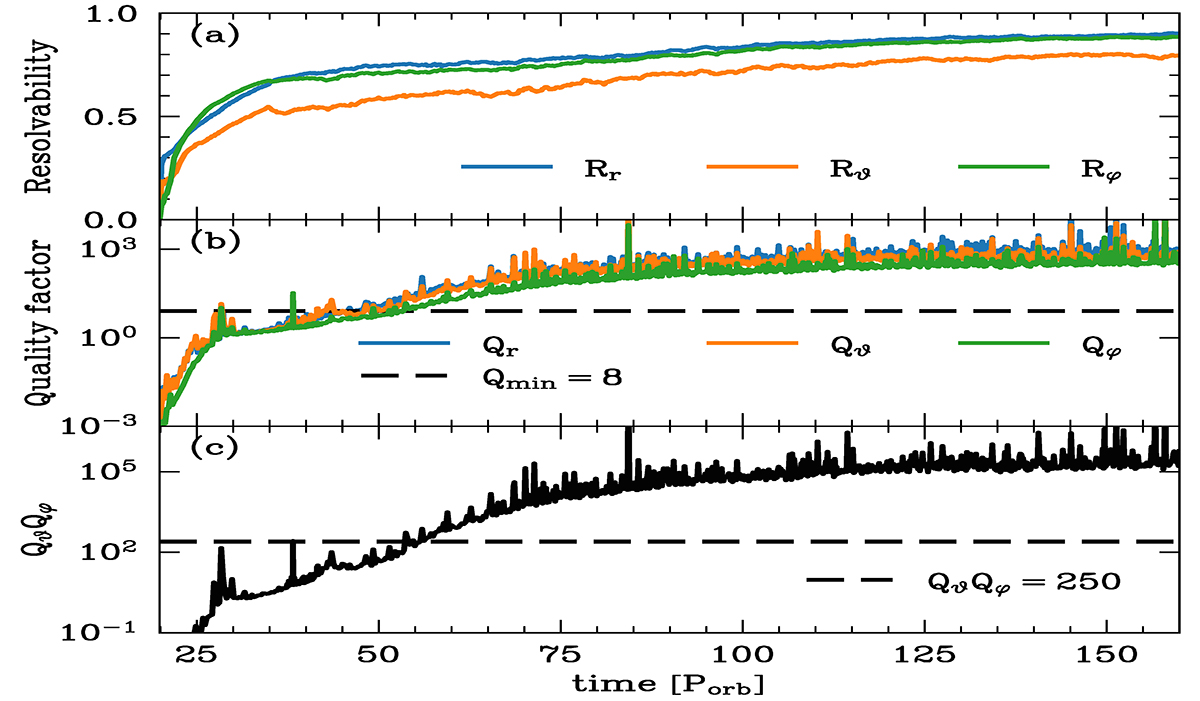
Temporal evolution of resolvability (panel a), quality factor (panel b), and QθQφ (panel c) in simulation run B. As the envelope expands within the numerical domain, these quantities progressively reach values that exceed the threshold values commonly associated with numerical convergence (horizontal dashed lines).
Current usage metrics show cumulative count of Article Views (full-text article views including HTML views, PDF and ePub downloads, according to the available data) and Abstracts Views on Vision4Press platform.
Data correspond to usage on the plateform after 2015. The current usage metrics is available 48-96 hours after online publication and is updated daily on week days.
Initial download of the metrics may take a while.