Open Access
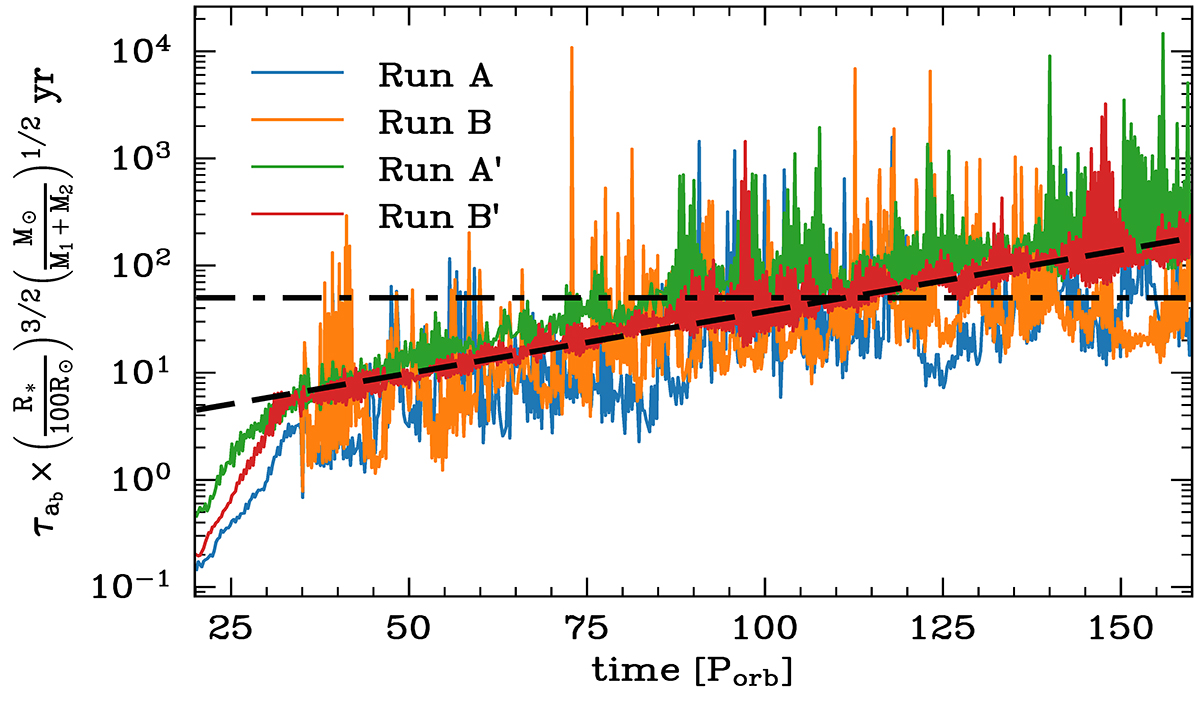
Fig. 15.
Download original image
Time evolution of the orbital separation evolution timescale for our two MHD runs B and B’, along with the non-MHD runs A and A’ from Gagnier & Pejcha (2023). The black dashed line represents τab = 50 yr, while the black dashdotted line corresponds to τab = λ10γt/Porb with λ = 0.42 and γ = 0.0115.
Current usage metrics show cumulative count of Article Views (full-text article views including HTML views, PDF and ePub downloads, according to the available data) and Abstracts Views on Vision4Press platform.
Data correspond to usage on the plateform after 2015. The current usage metrics is available 48-96 hours after online publication and is updated daily on week days.
Initial download of the metrics may take a while.