Fig. 7.
Download original image
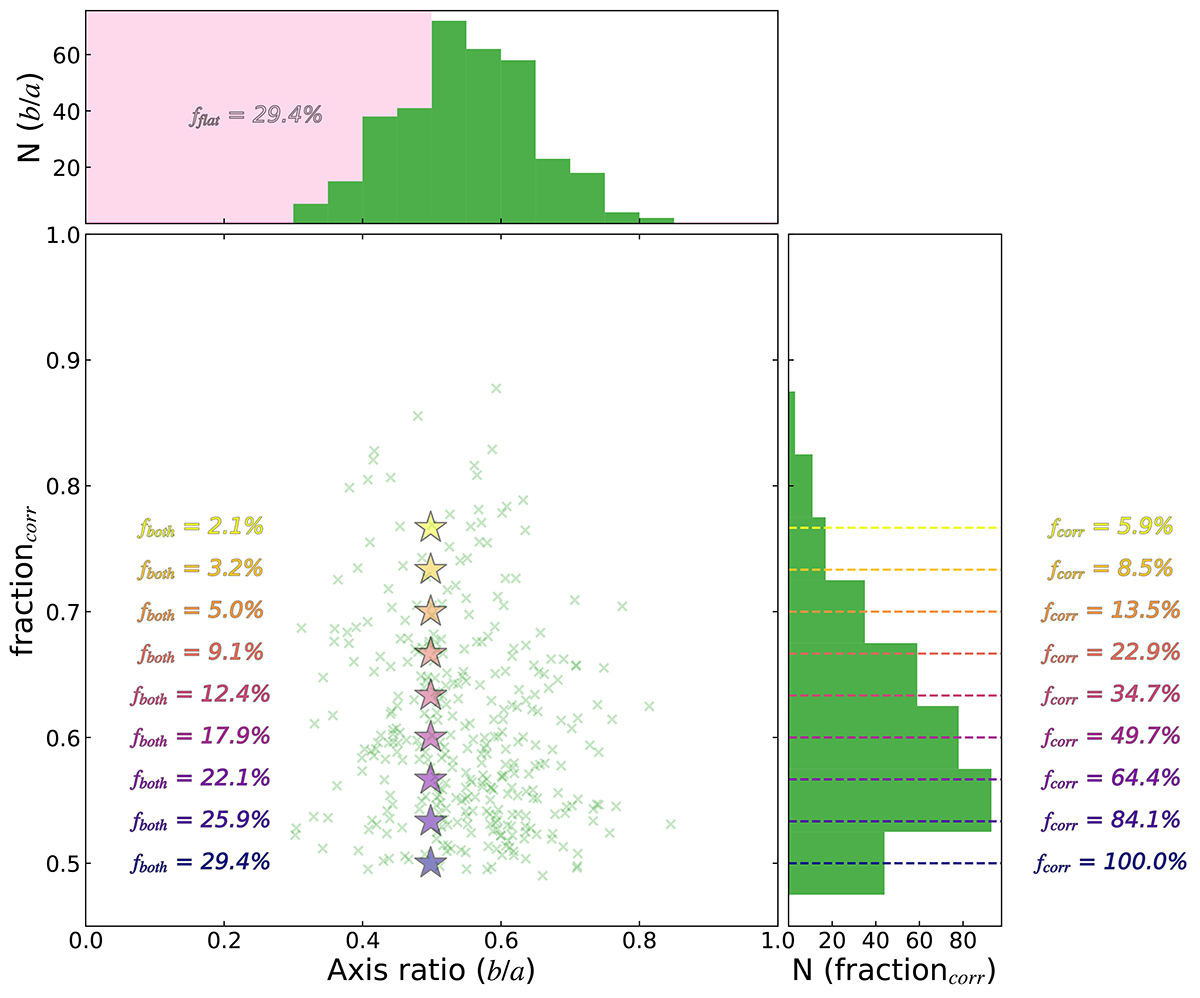
Same as Fig. 6 (right), but illustrating the possible outcomes given lacking velocity measurements. The colored stars show the possible axis ratios and fractions of corotation in the data. The flatness of the structure will not change with new velocity information because distance measurements are available for all dwarfs. The fractions of corotation can vary from 0.5 (15/30) to 0.76 (23/30). For each possible scenario, the fraction of simulated systems that match or exceed the degree of kinematic correlation is shown in the histogram to the right. The fractions of systems that show both flatness and a degree of corotation similar to or more extreme than the data are shown in the center.
Current usage metrics show cumulative count of Article Views (full-text article views including HTML views, PDF and ePub downloads, according to the available data) and Abstracts Views on Vision4Press platform.
Data correspond to usage on the plateform after 2015. The current usage metrics is available 48-96 hours after online publication and is updated daily on week days.
Initial download of the metrics may take a while.