Fig. 2.
Download original image
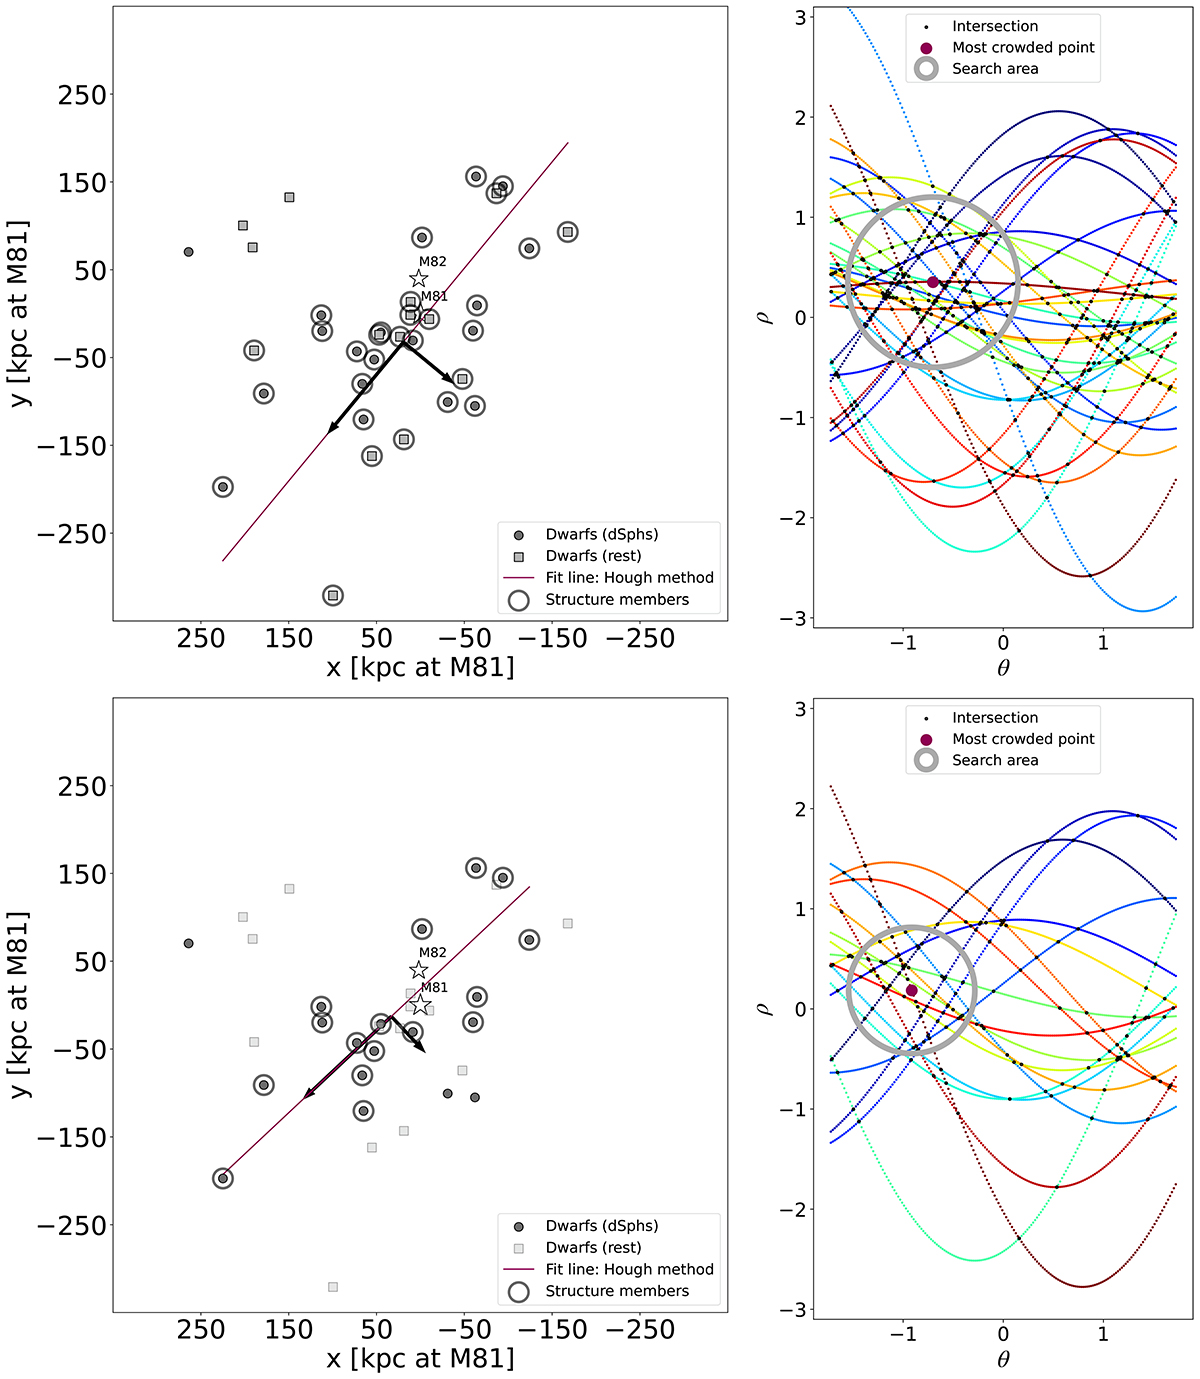
Detecting linear structures with the Hough transform. Left: M81 group satellite system in relative coordinates, with M81 (star) at the origin and indicating projected separations at the distance of M 81 in kpc. M 82 is shown as an empty star. The dwarf satellites of different morphologies are shown as circles and squares. We emphasize the abundance of dwarf spheroidals (dSphs) as black circles compared to other morphologies as gray squares. The best-fit line is determined via the Hough method, which finds all but four satellites (upper left corner) to be members (circled gray) of a flattened structure. The rms dimensions of this structure are indicated with black arrows. Top: Results using all morphological types of satellites. Bottom: Only using the dSphs. Right: M 81 satellite system in the Hough parameter space. The parameter ρ plotted on the y-axis is the normal distance from the fit line to the origin, while θ is the angle between this ρ vector and the x-axis in the image space. Each curve corresponds to a series of possible parameter pairs for one dwarf. The curves are z-score normalized along each axis, i.e., they have a mean of zero and a standard deviation of one. The red dot indicates the parameter pair at the center of the densest crossing region (gray circle), which is optimized to maximize the number of structure members and the flatness of the system simultaneously. The curves that do not cross the gray region stem from the declared outliers in the scatter plot left.
Current usage metrics show cumulative count of Article Views (full-text article views including HTML views, PDF and ePub downloads, according to the available data) and Abstracts Views on Vision4Press platform.
Data correspond to usage on the plateform after 2015. The current usage metrics is available 48-96 hours after online publication and is updated daily on week days.
Initial download of the metrics may take a while.