Fig. 1.
Download original image
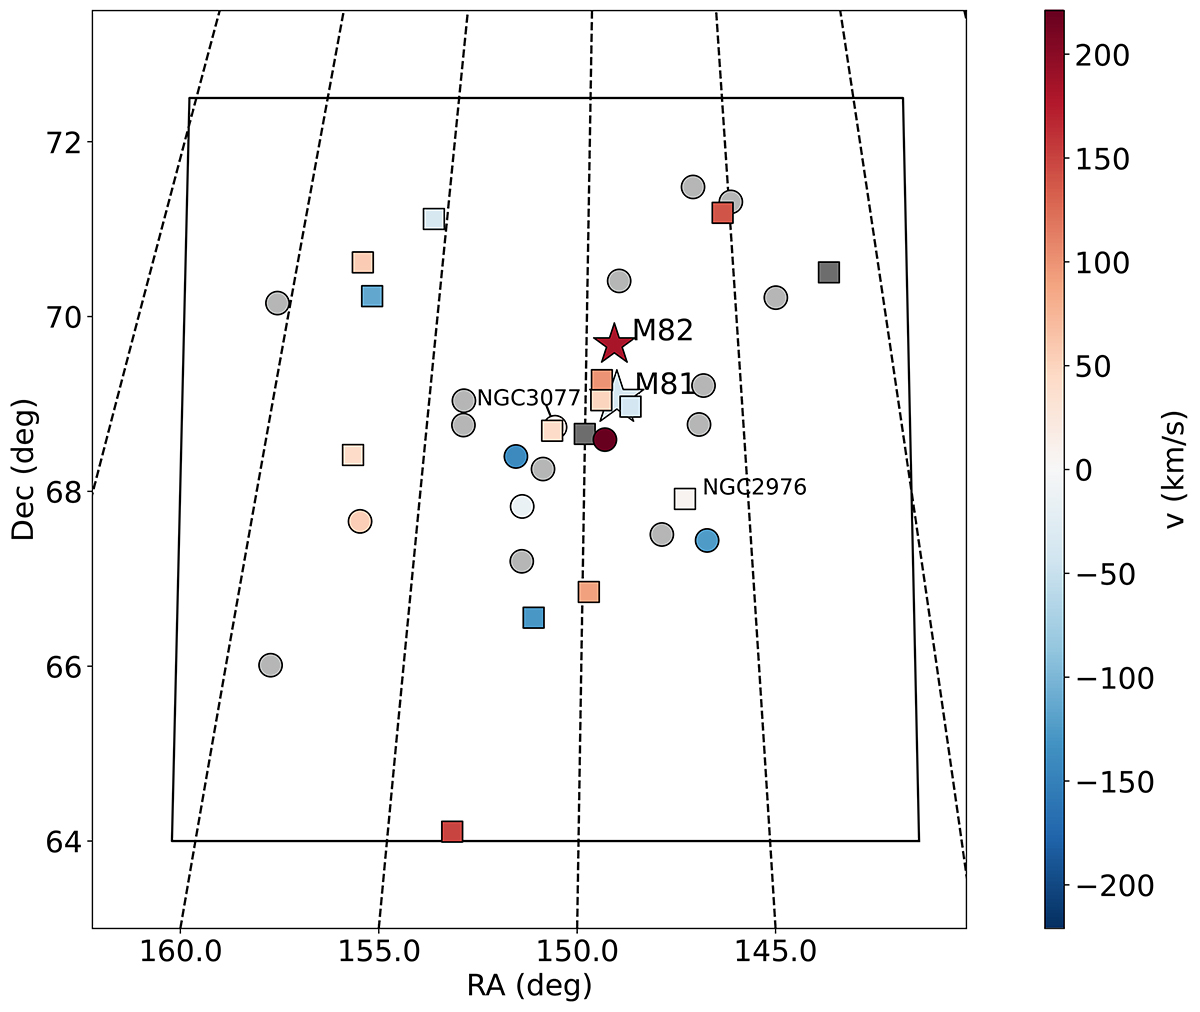
Survey footprint from Chiboucas et al. (2009, 2013). The two main galaxies M 81 and M 82 are indicated as stars, the dwarf spheroidals are shown as dots, and the dwarf irregulars are plotted as squares. The two brightest satellites (NGC 2976 and NGC 3077) are marked. The colors indicate the observed velocities. Gray means that no velocity measurement is currently available.
Current usage metrics show cumulative count of Article Views (full-text article views including HTML views, PDF and ePub downloads, according to the available data) and Abstracts Views on Vision4Press platform.
Data correspond to usage on the plateform after 2015. The current usage metrics is available 48-96 hours after online publication and is updated daily on week days.
Initial download of the metrics may take a while.