Open Access
Fig. 6
Download original image
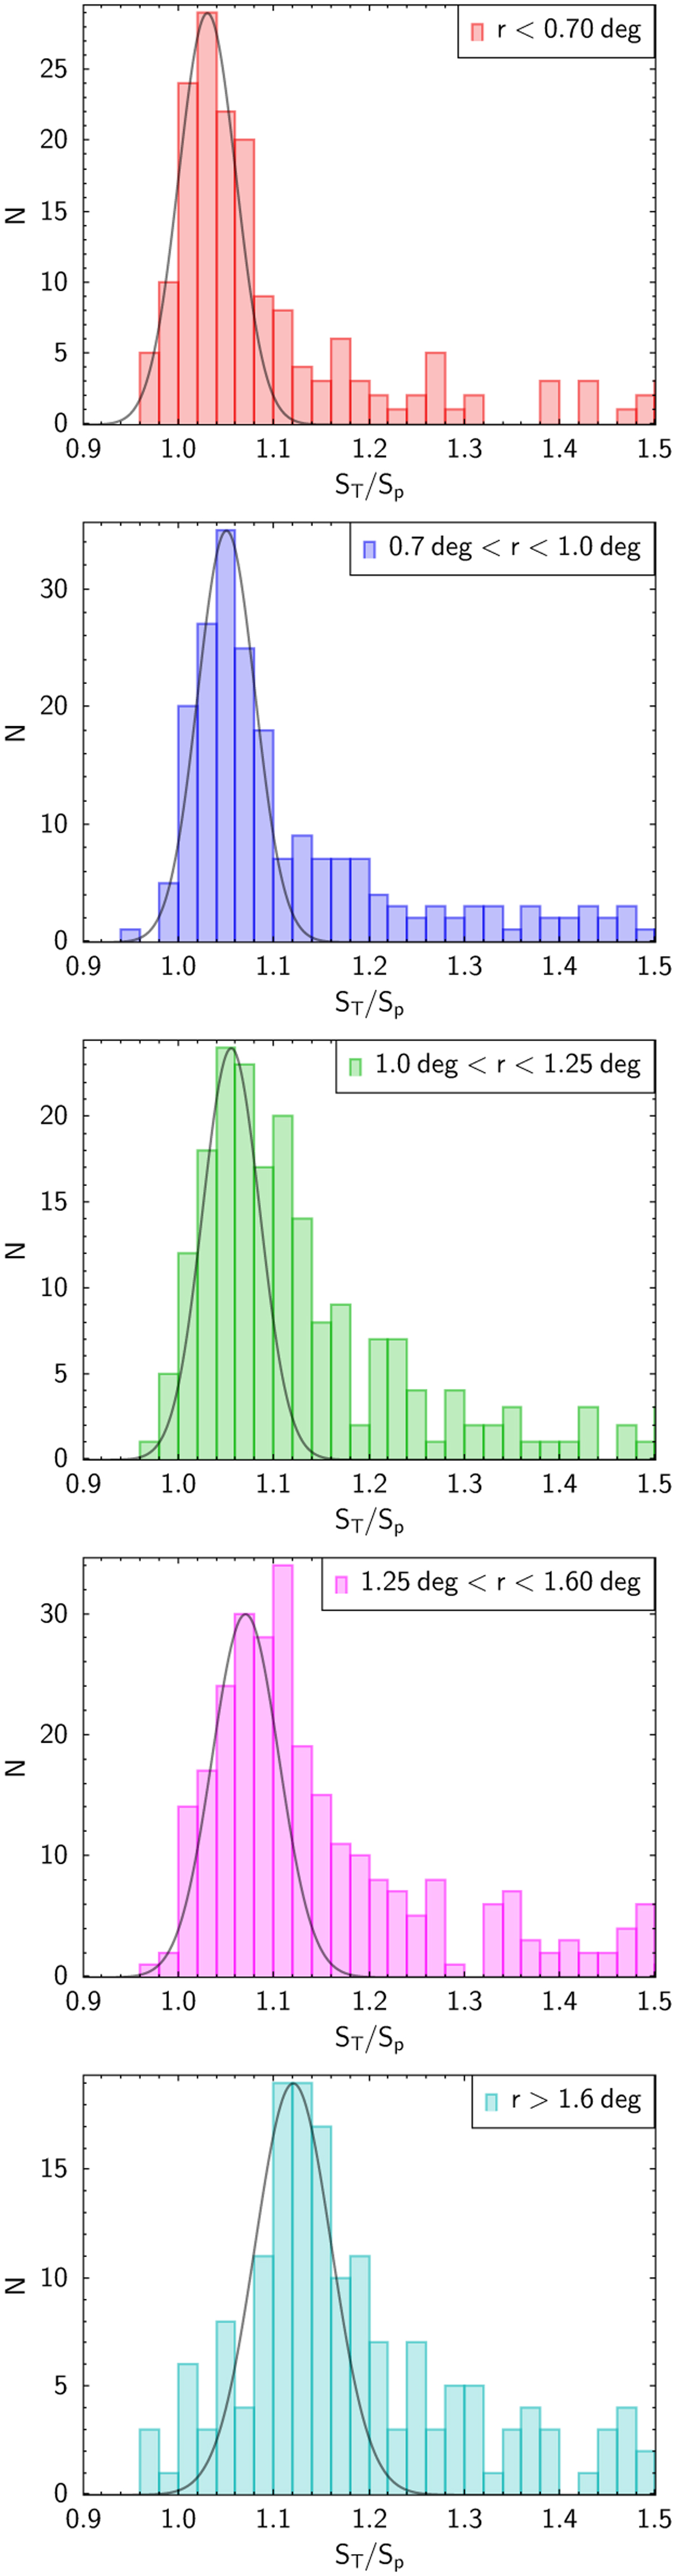
Distribution of ST/Sp values for sources in different bins of distance from field centre. Only sources with SNR > 40 are considered. The plots are truncated at ST/Sp = 1.5 for a better visualisation. For each distance bin, we fit a Gaussian function to the region of low ST/Sp values.
Current usage metrics show cumulative count of Article Views (full-text article views including HTML views, PDF and ePub downloads, according to the available data) and Abstracts Views on Vision4Press platform.
Data correspond to usage on the plateform after 2015. The current usage metrics is available 48-96 hours after online publication and is updated daily on week days.
Initial download of the metrics may take a while.