Fig. 5
Download original image
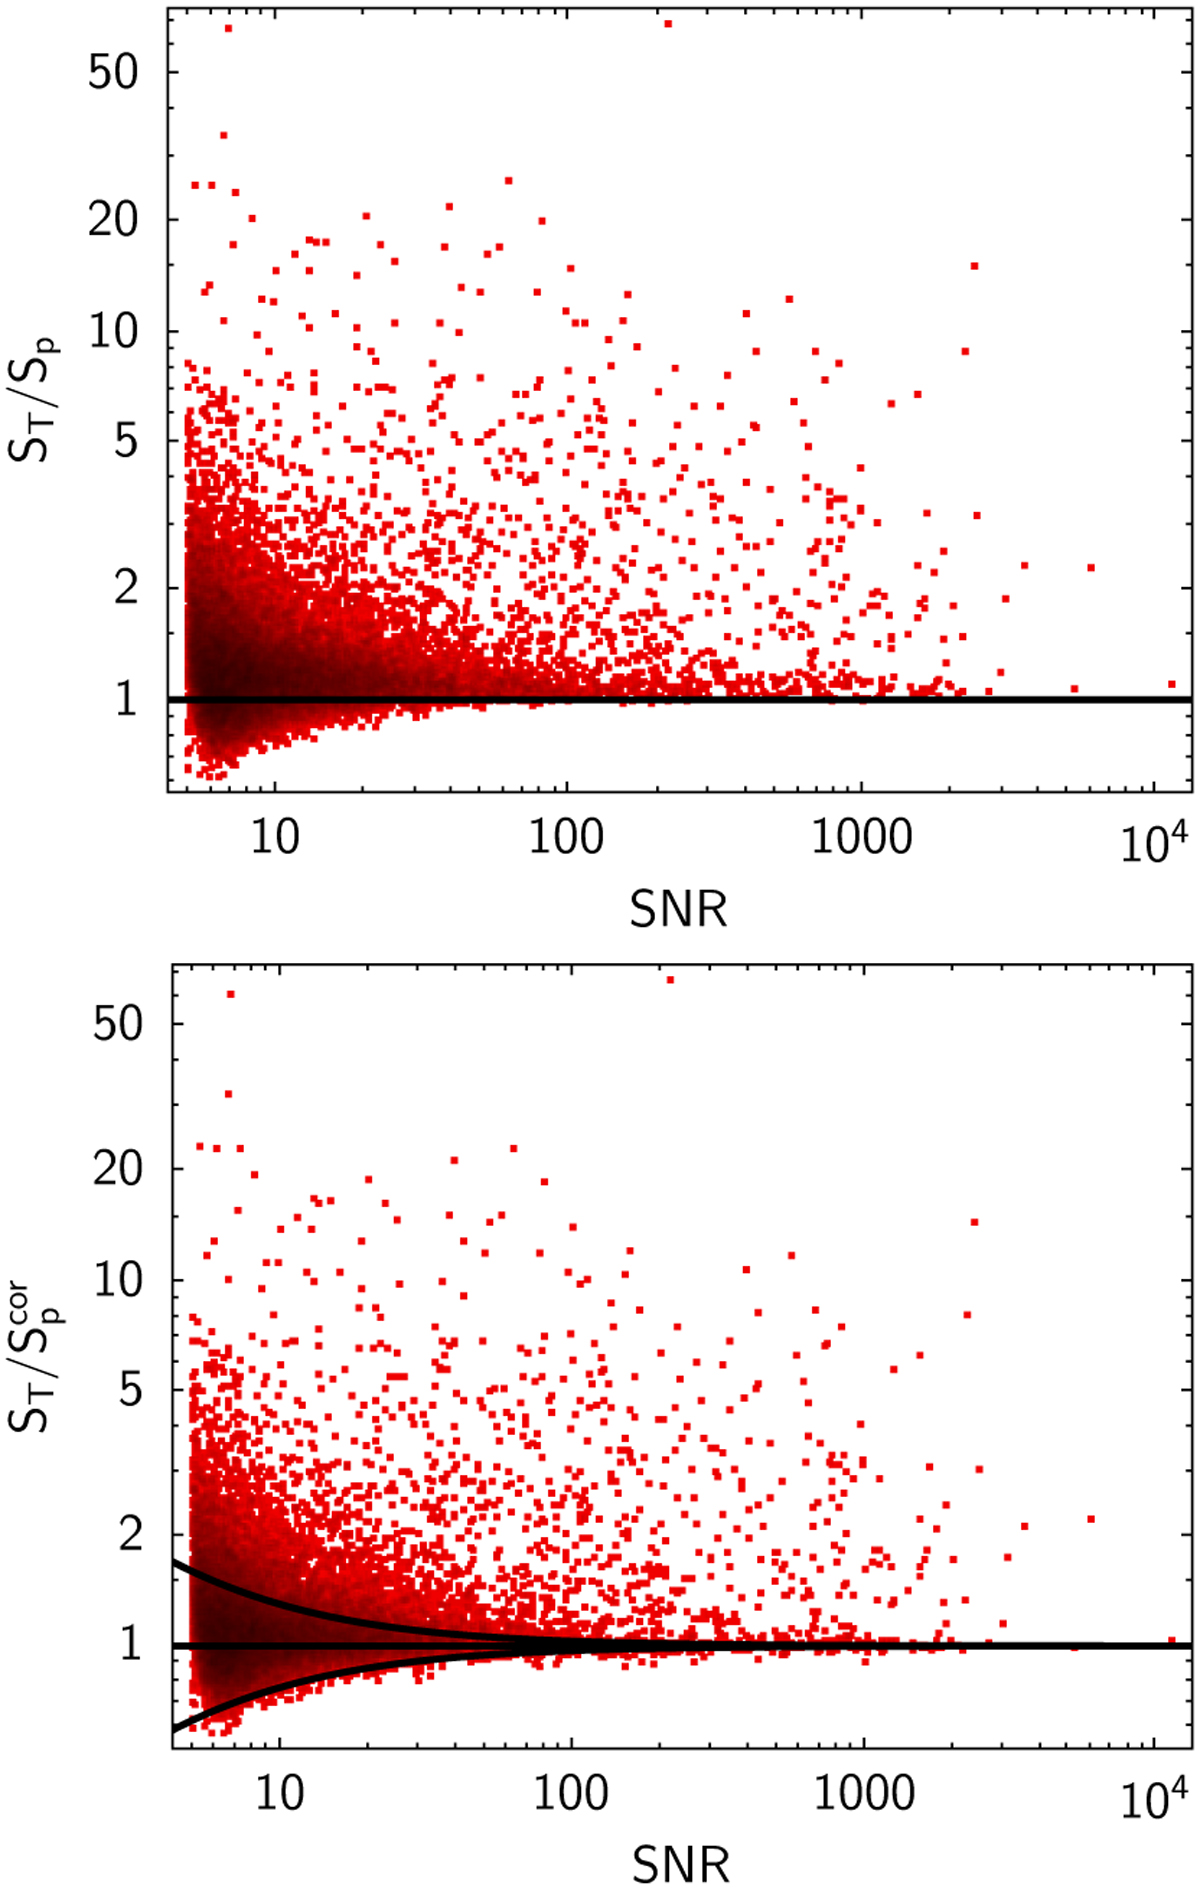
Total-to-peak flux ratio versus signal-to-noise ratio plot for all the sources in the catalogue. The upper panel shows the ratio derived using the Sp values derived by PyBDSF. The lower panel shows the same plot using ![]() instead of
instead of ![]() is the corrected peak flux obtained by multiplying Sp by a radially dependent correction factor (see Sect. 4.4 for details). The upper black line separates resolved from unresolved sources according to the relation
is the corrected peak flux obtained by multiplying Sp by a radially dependent correction factor (see Sect. 4.4 for details). The upper black line separates resolved from unresolved sources according to the relation ![]() . The lower black line shows the mirrored relation.
. The lower black line shows the mirrored relation.
Current usage metrics show cumulative count of Article Views (full-text article views including HTML views, PDF and ePub downloads, according to the available data) and Abstracts Views on Vision4Press platform.
Data correspond to usage on the plateform after 2015. The current usage metrics is available 48-96 hours after online publication and is updated daily on week days.
Initial download of the metrics may take a while.