Fig. 3
Download original image
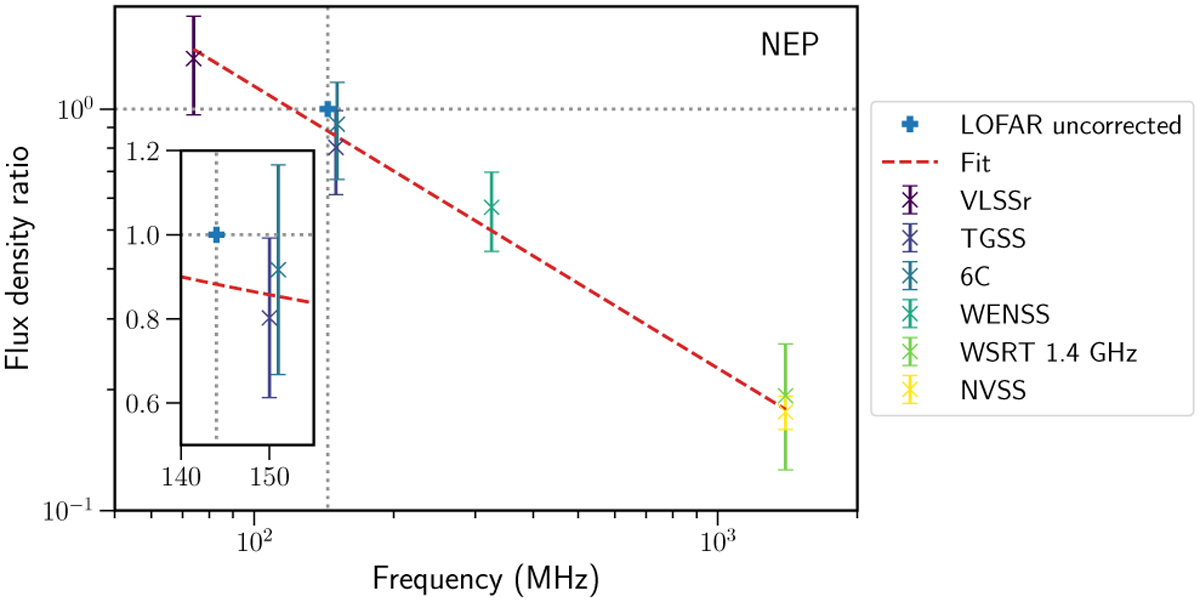
Calibration of EDFN flux density scale. The flux density scale after DDF-pipeline is set to unity and shown as a blue cross. The flux density ratios with respect to the external catalogues from the literature and their errors are shown in different colours. The red dashed line is the linear fit to the data. The inset shows a zoomed-in view close to the LOFAR HBA central frequency.
Current usage metrics show cumulative count of Article Views (full-text article views including HTML views, PDF and ePub downloads, according to the available data) and Abstracts Views on Vision4Press platform.
Data correspond to usage on the plateform after 2015. The current usage metrics is available 48-96 hours after online publication and is updated daily on week days.
Initial download of the metrics may take a while.