Fig. 2
Download original image
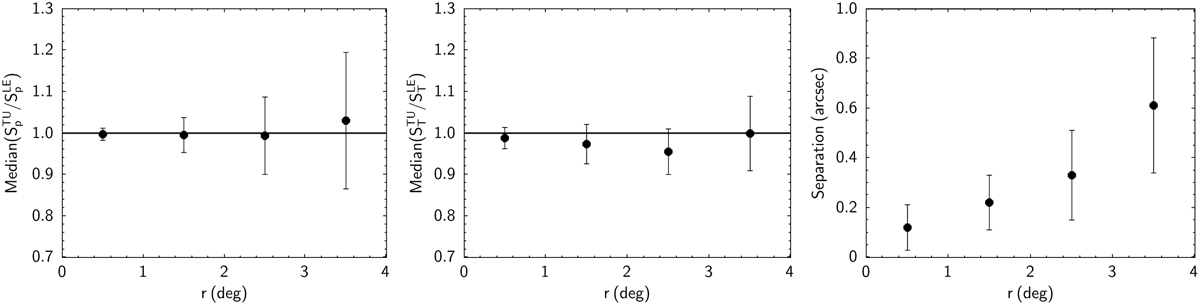
Median peak brightness ratio (left panel), median total flux density ratio (middle panel), and median absolute value separation (right panel) in the four annular regions at increasing distance r from the pointing centre for matched sources in the Turin and Leiden catalogues with SNR > 50. The error bars are the scaled median absolute deviation (MAD) values.
Current usage metrics show cumulative count of Article Views (full-text article views including HTML views, PDF and ePub downloads, according to the available data) and Abstracts Views on Vision4Press platform.
Data correspond to usage on the plateform after 2015. The current usage metrics is available 48-96 hours after online publication and is updated daily on week days.
Initial download of the metrics may take a while.