Fig. 6
Download original image
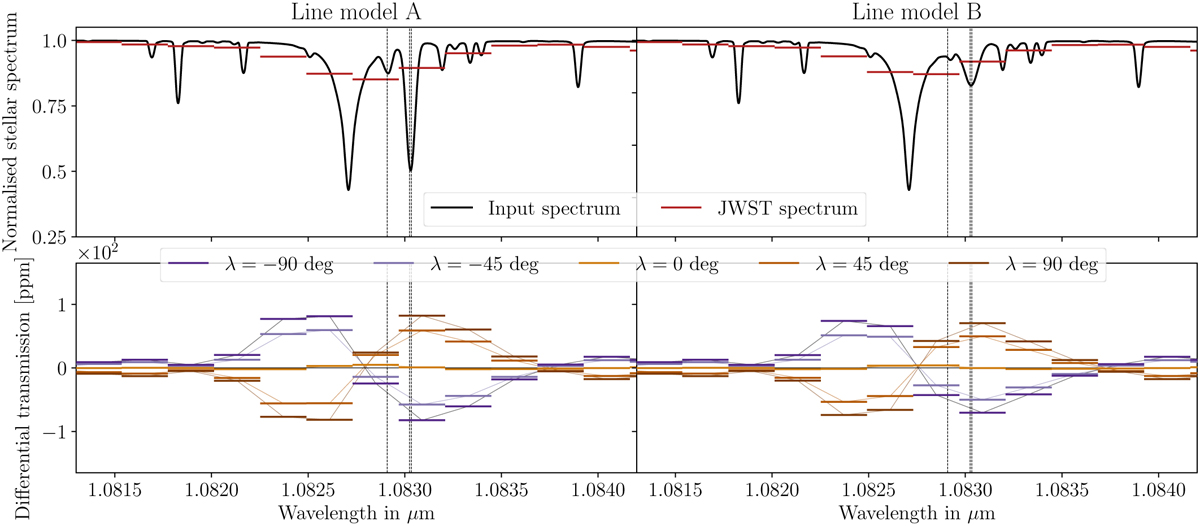
Helium analysis. Black dashed lines highlight the three metastable lines. Top panel: Synthetic spectrum of the K-type star used in our simulations (in black, at high resolution) and as measured with JWST/NIRSPEC in G140H-f70 mode (in red, 2.4 Å -wide pixels, ℛ = 2050) in the star rest frame. Bottom panel: Simulated differential transmission spectra as measured with NIRSPEC in the planet rest frame, averaged over the full transit and shown for different spin-orbit angles.
Current usage metrics show cumulative count of Article Views (full-text article views including HTML views, PDF and ePub downloads, according to the available data) and Abstracts Views on Vision4Press platform.
Data correspond to usage on the plateform after 2015. The current usage metrics is available 48-96 hours after online publication and is updated daily on week days.
Initial download of the metrics may take a while.