Fig. 5
Download original image
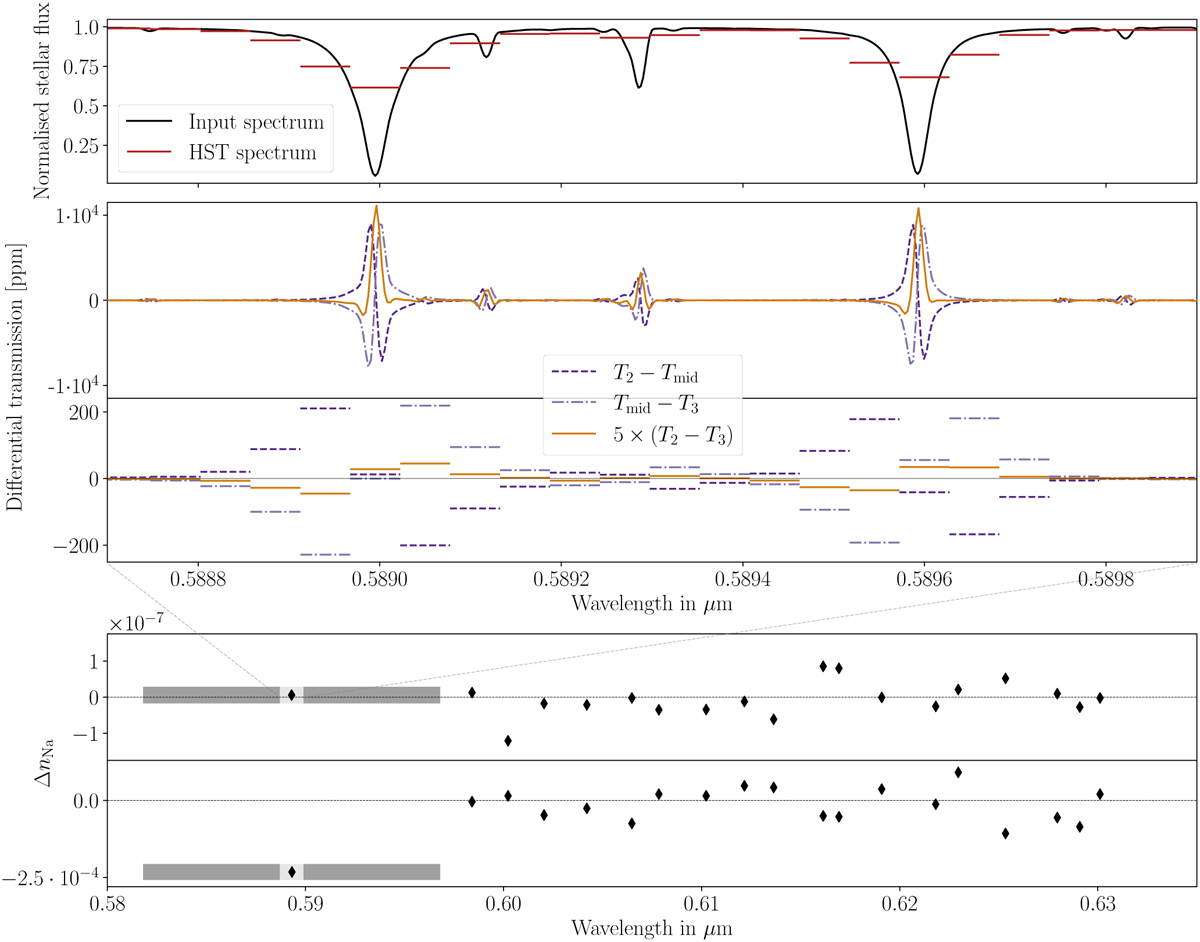
Sodium analysis of HD 209458b. All spectra are shown in the stellar rest frame. First panel (top): Synthetic spectrum of HD 209458 used in our simulations (black, at high resolution) and as measured with HST/STIS (red, 0.55 Å-wide pixels, ℛ = 5440). Second panel: Simulated differential transmission spectra of HD 209458b without atmosphere as measured with ESPRESSO (0.04 Å-wide pixels, ℛ = 140 000), averaged over different phases of the transit. Third panel: Simulated differential transmission spectrum of HD 209458b as measured with STIS and averaged over the full transit. Fourth panel: Simulated Δn (Eq. (3)), comparable to the observed values in the fifth panel. All points are computed using the same three bins defined in Eq. (2), centered on different stellar lines. Shaded areas are associated with the sodium doublet (light gray for the central bin bc, dark gray for the red and blue bins br and bb). Fifth panel (bottom): Measured Δn from Fig. 5 in Charbonneau et al. (2002).
Current usage metrics show cumulative count of Article Views (full-text article views including HTML views, PDF and ePub downloads, according to the available data) and Abstracts Views on Vision4Press platform.
Data correspond to usage on the plateform after 2015. The current usage metrics is available 48-96 hours after online publication and is updated daily on week days.
Initial download of the metrics may take a while.