Fig. 3
Download original image
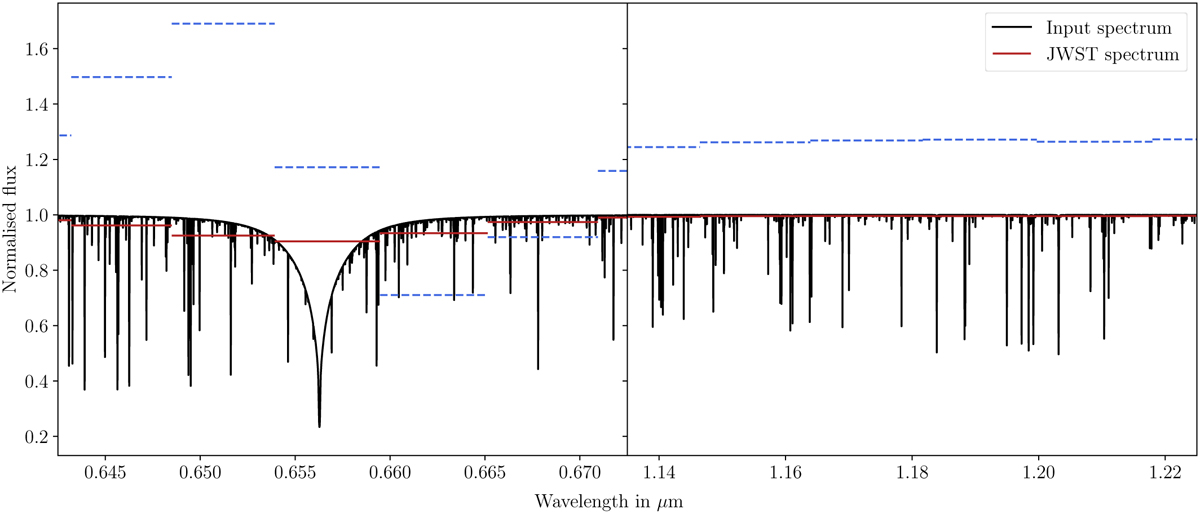
Normalized stellar spectrum of the F-type star at high resolution (black) and as seen by JWST/NIRSPEC (red bins) in prism mode (30 ≤ ℛ ≤ 65). Dashed blue bins represent the differential transmission spectrum at T = –0.25 h (see Fig. 2) arbitrarily scaled. The differential transmission spectrum was shifted by 1 to be visible together with the flux spectrum. The left panel shows a zoomed-in image of a deep and broad stellar line.
Current usage metrics show cumulative count of Article Views (full-text article views including HTML views, PDF and ePub downloads, according to the available data) and Abstracts Views on Vision4Press platform.
Data correspond to usage on the plateform after 2015. The current usage metrics is available 48-96 hours after online publication and is updated daily on week days.
Initial download of the metrics may take a while.