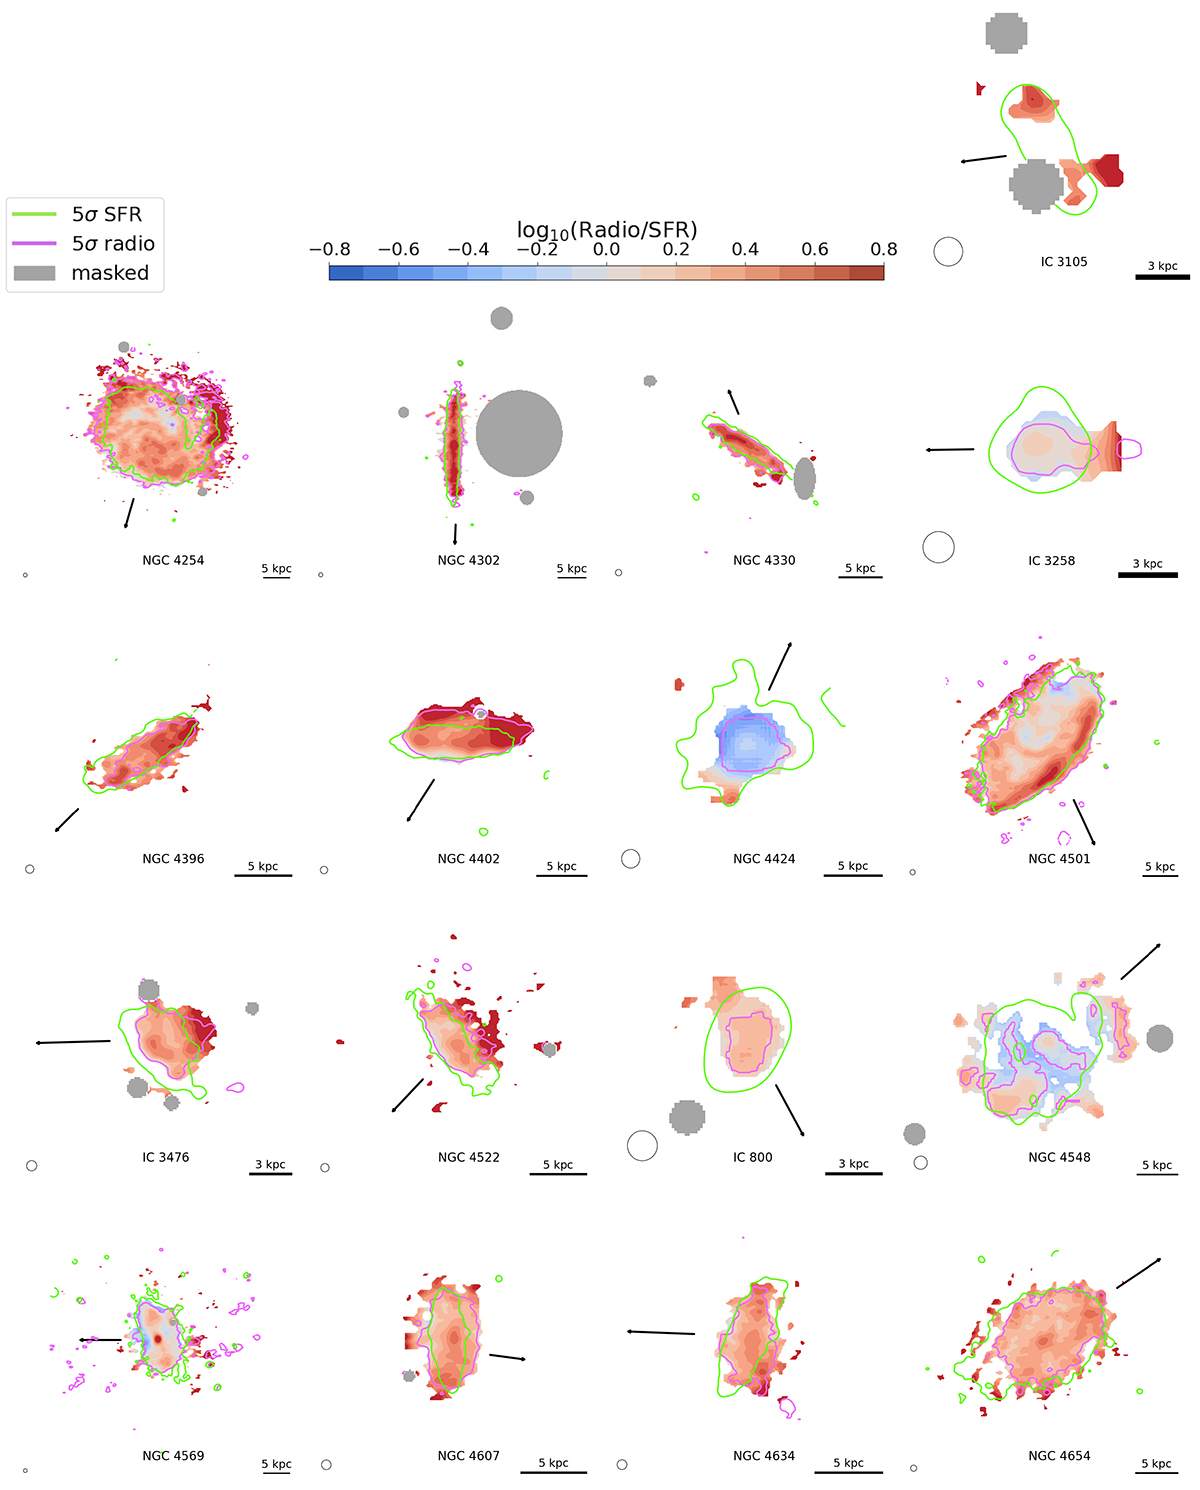
Fig. 8.
Download original image
Logarithmic ratio between the observed and modeled radio emission. The color scale is symmetric and increases in increments of 0.1 dex, red colors indicate a local radio excess, blue colors a radio deficit and gray areas are masked background sources. Magenta and green lines are the 5σ contours of Bobs and ΣSFR, respectively. The black arrow indicates the approximate orbit of the galaxy as inferred from the direction of the tail. The circles in the bottom left correspond to the angular resolution of the radio data, which is 9″, except for IC 3105, IC 3258, NGC 4424, IC 800 and NGC 4654 where we used maps at 20″ resolution.
Current usage metrics show cumulative count of Article Views (full-text article views including HTML views, PDF and ePub downloads, according to the available data) and Abstracts Views on Vision4Press platform.
Data correspond to usage on the plateform after 2015. The current usage metrics is available 48-96 hours after online publication and is updated daily on week days.
Initial download of the metrics may take a while.