Fig. 7.
Download original image
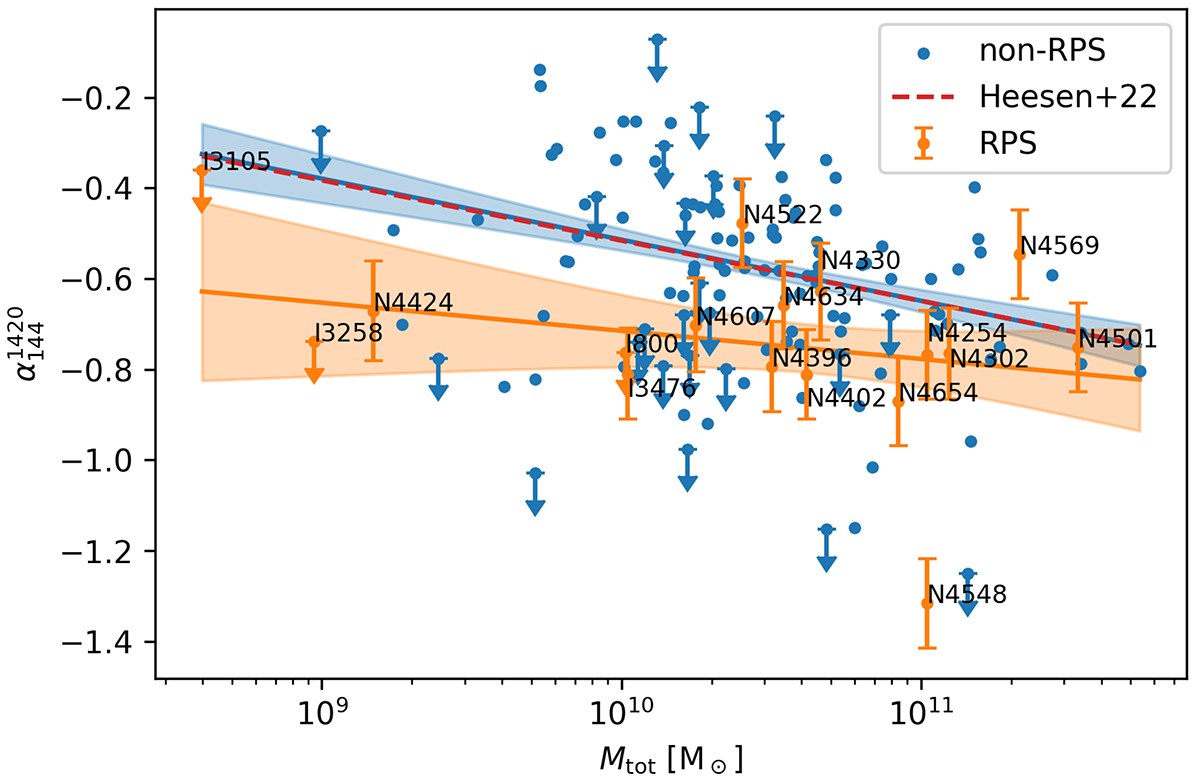
Total mass against the spectral index for the RPS sample (orange markers and labels) and the other galaxies in the sample (blue markers). For clarity, uncertainties are only displayed for the RPS sample, they are of comparable size (σα ∼ 0.1) for the other galaxies. Downward pointing arrows correspond to 4σ upper limits. The orange and blue line show the corresponding best-fitting relations, and the red dashed line shows the fit from Heesen et al. (2022).
Current usage metrics show cumulative count of Article Views (full-text article views including HTML views, PDF and ePub downloads, according to the available data) and Abstracts Views on Vision4Press platform.
Data correspond to usage on the plateform after 2015. The current usage metrics is available 48-96 hours after online publication and is updated daily on week days.
Initial download of the metrics may take a while.