Open Access
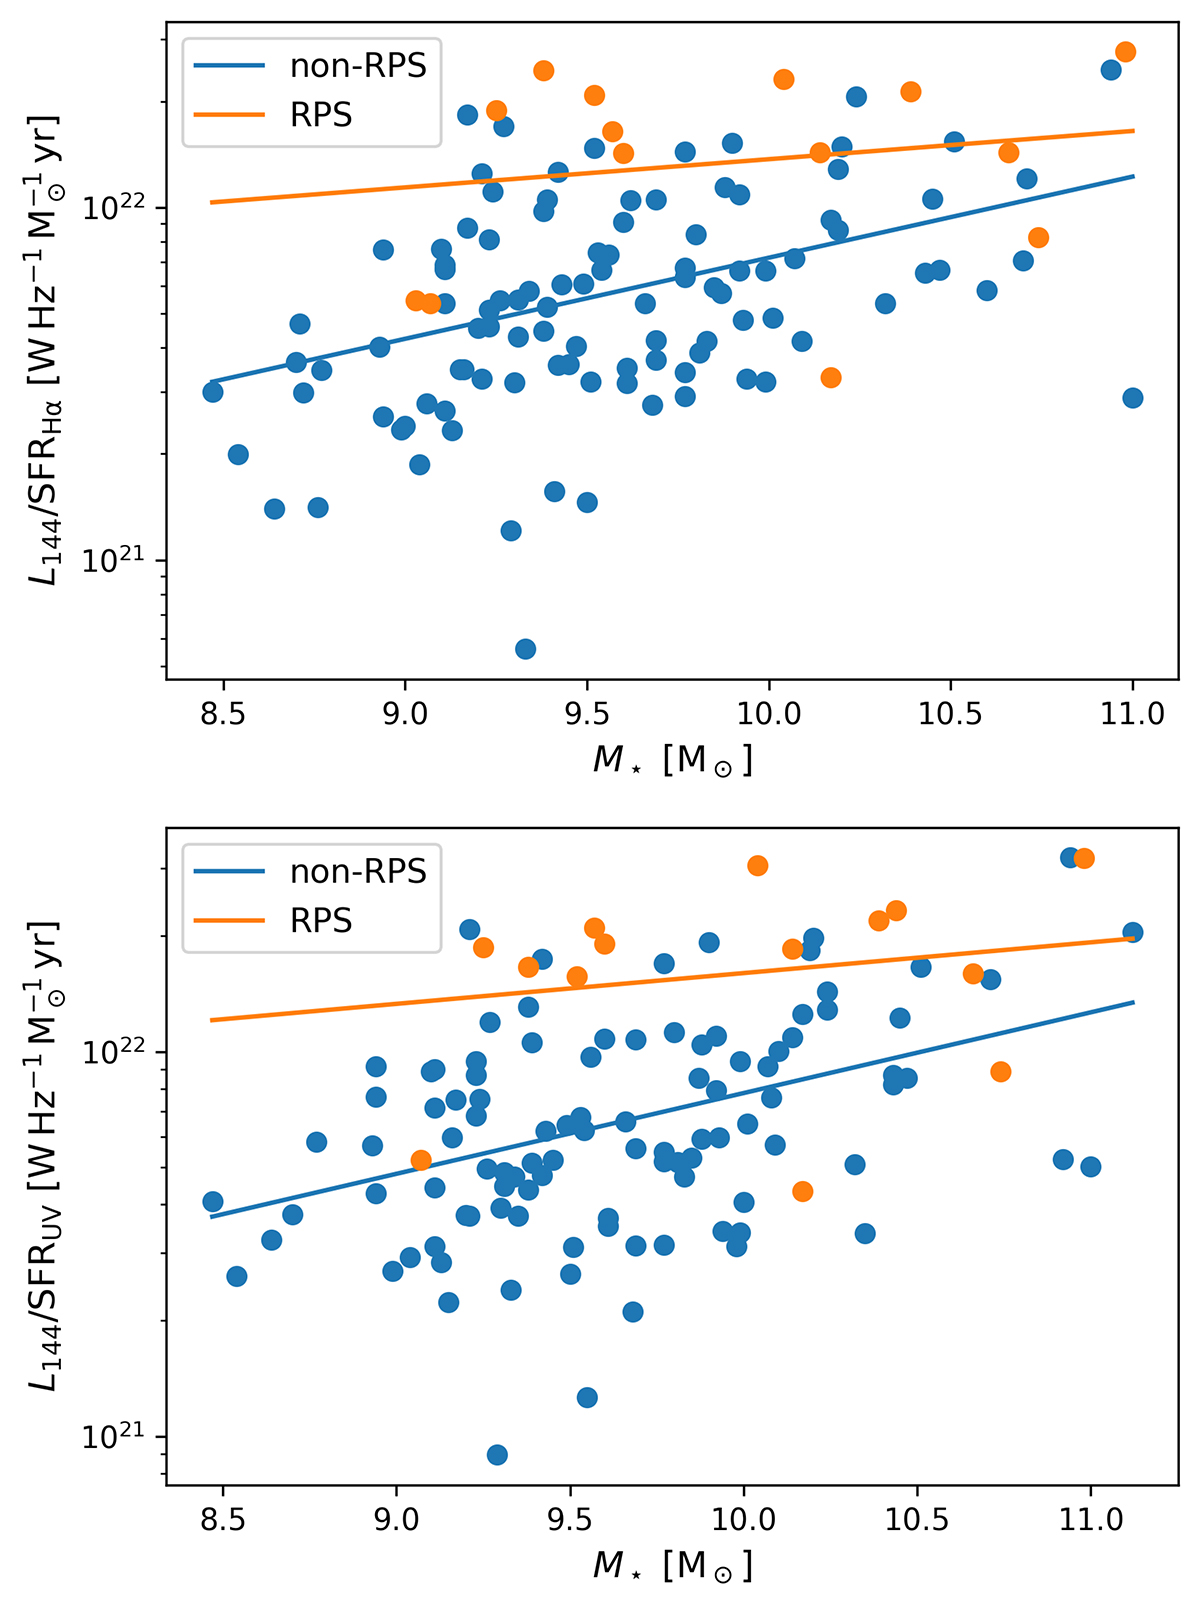
Fig. 5.
Download original image
Radio–SFR relations taking into account the stellar mass. Top panel: ratio of L144 to SFRHα as a function of M⋆. The orange data points mark the galaxies in the RPS sample, the blue ones the galaxies outside the RPS sample. The orange and blue lines are the corresponding fits. Bottom panel: same but for the UV-inferred SFR.
Current usage metrics show cumulative count of Article Views (full-text article views including HTML views, PDF and ePub downloads, according to the available data) and Abstracts Views on Vision4Press platform.
Data correspond to usage on the plateform after 2015. The current usage metrics is available 48-96 hours after online publication and is updated daily on week days.
Initial download of the metrics may take a while.