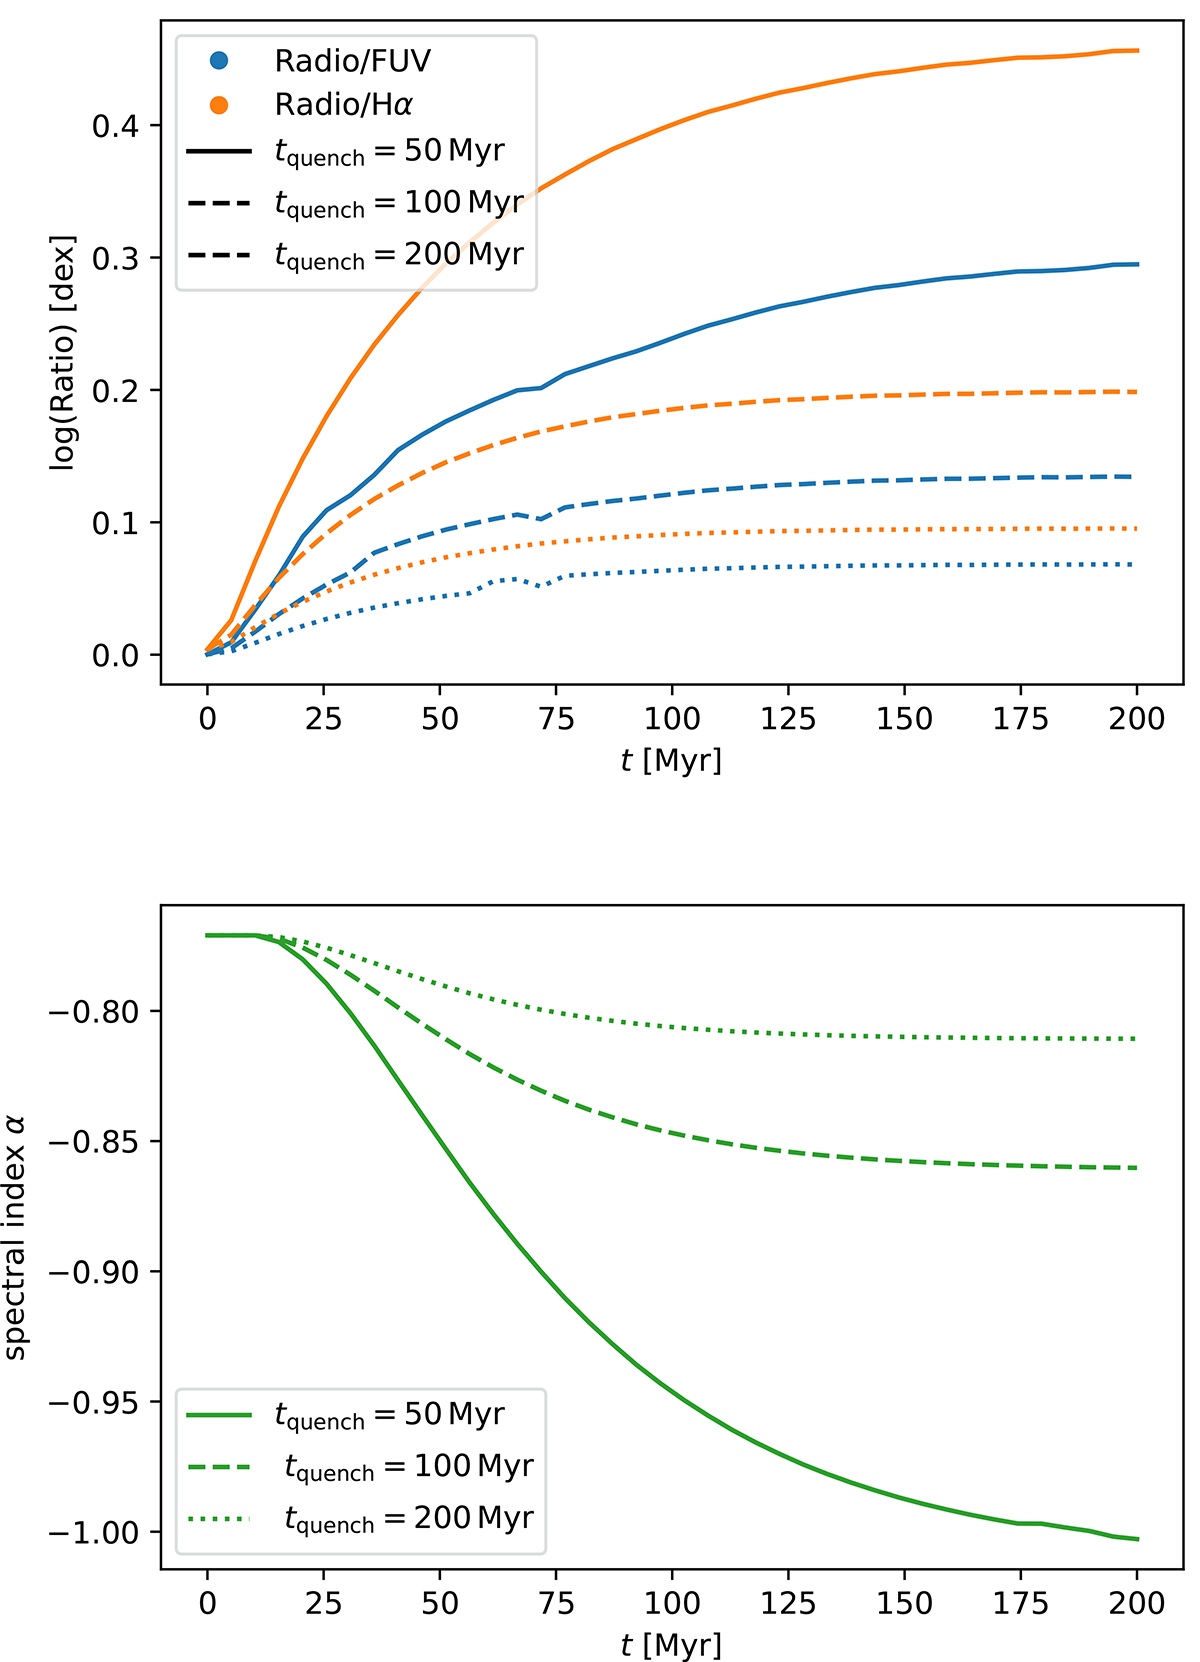
Fig. 9.
Download original image
Scenario (1) – quenched star formation model. Top panel: log ratio of the 144 MHz to FUV emission (blue) and Hα emission (orange) for a quenching time of 50 Myr (solid lines), 100 Myr (dashed lines), and 200 Myr (dotted lines) as a function of the time since the onset of SFR quenching. The ratios are relative to t = 0. Bottom panel: evolution of the 144 MHz to 1.4 GHz spectral index for the two models.
Current usage metrics show cumulative count of Article Views (full-text article views including HTML views, PDF and ePub downloads, according to the available data) and Abstracts Views on Vision4Press platform.
Data correspond to usage on the plateform after 2015. The current usage metrics is available 48-96 hours after online publication and is updated daily on week days.
Initial download of the metrics may take a while.