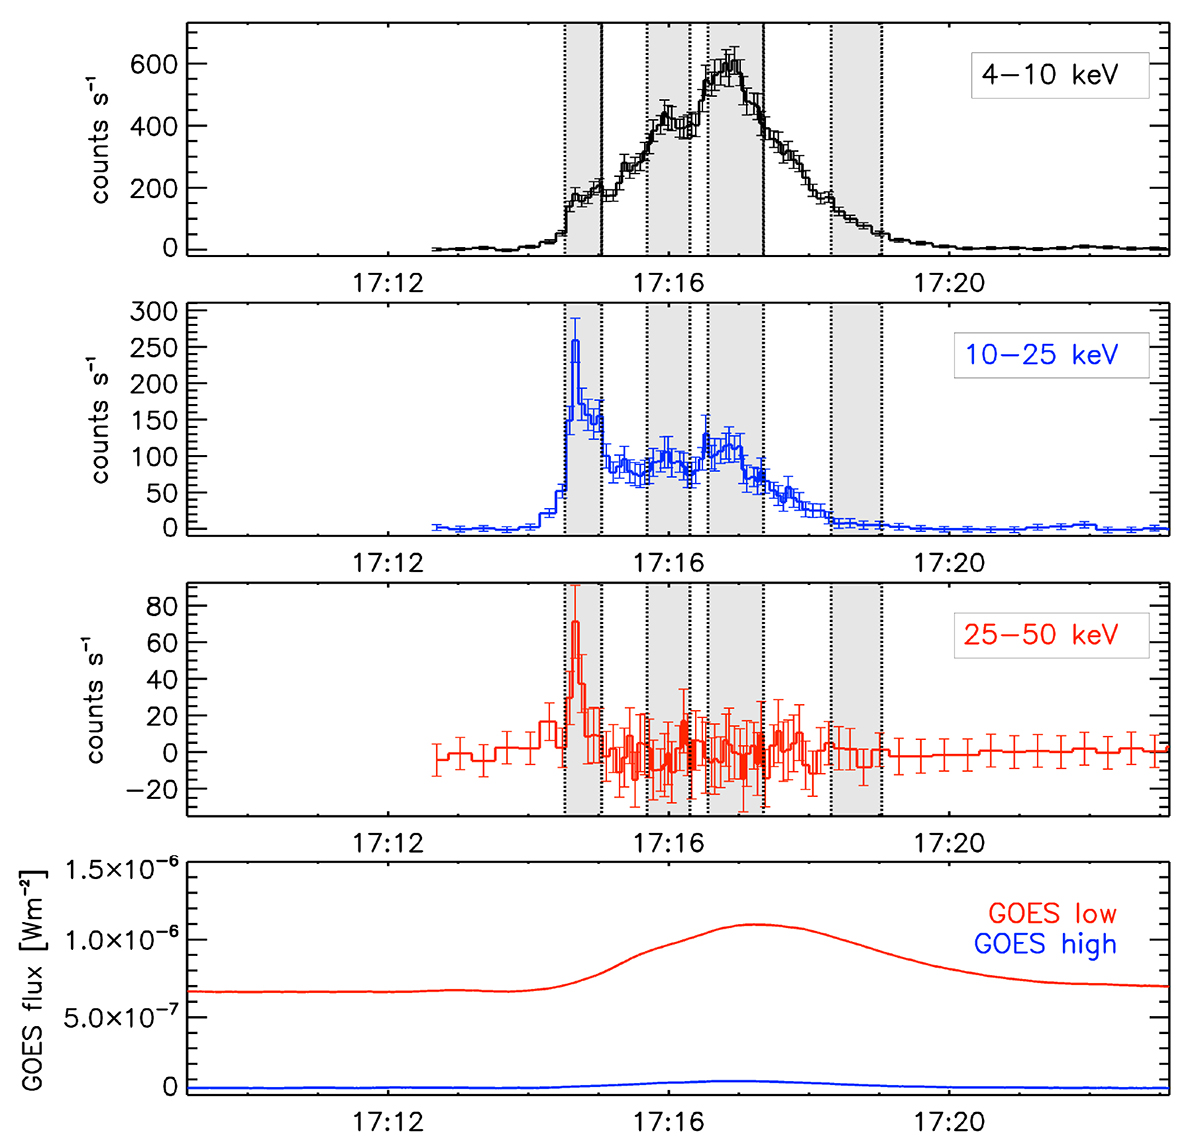
Fig. 7.
Download original image
Time evolution of soft and hard X-rays. Light curves of the November 10, 2022 flare. Top panels: STIX counts in selected energy bins from 4 to 50 keV. Bottom: GOES 1−8 Å (red) and 0.5−4 Å (blue) soft X-ray fluxes. Shaded areas indicate the time spans considered in the spectral fitting.
Current usage metrics show cumulative count of Article Views (full-text article views including HTML views, PDF and ePub downloads, according to the available data) and Abstracts Views on Vision4Press platform.
Data correspond to usage on the plateform after 2015. The current usage metrics is available 48-96 hours after online publication and is updated daily on week days.
Initial download of the metrics may take a while.