Fig. 6.
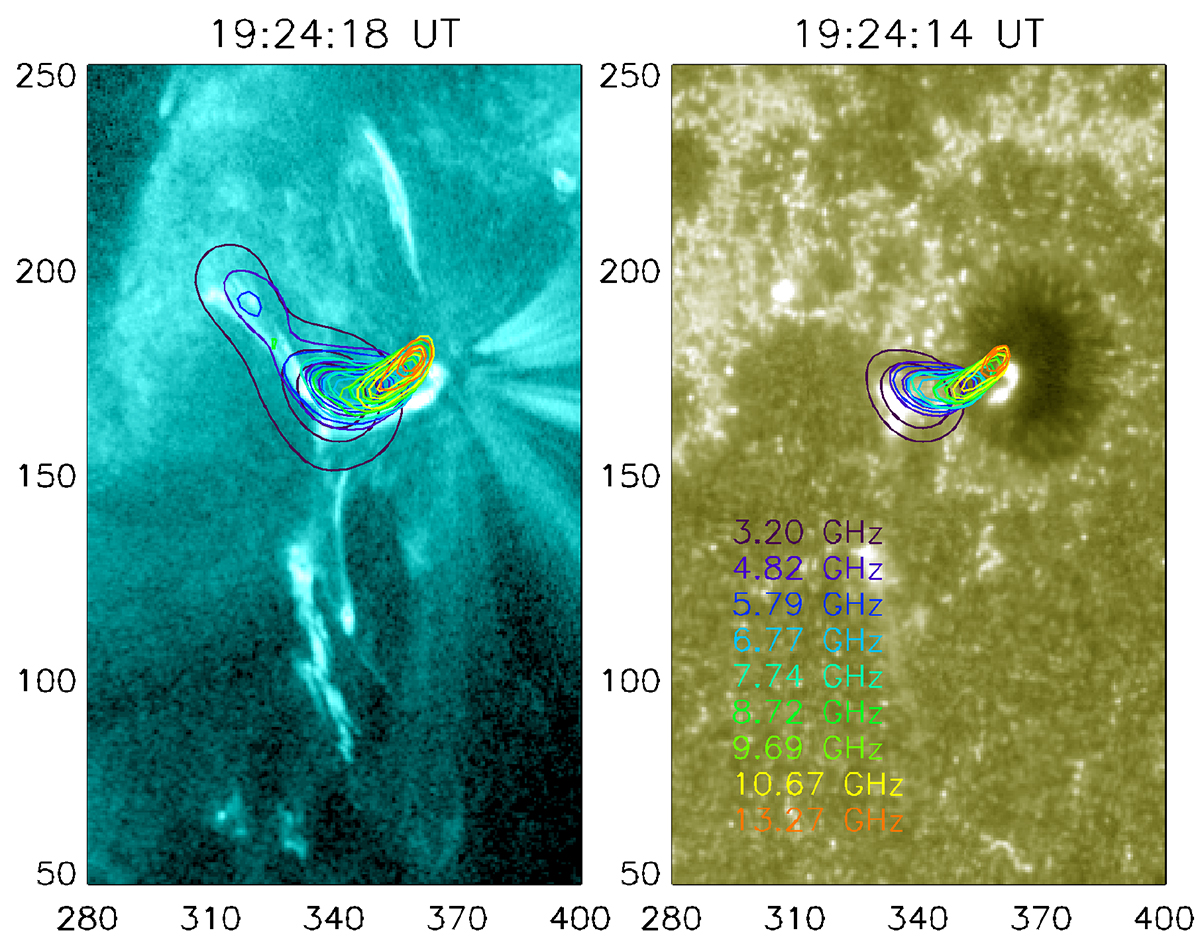
Download original image
Radio, UV and EUV observations. Contours of EOVSA radio images at various frequencies from 3.20 to 13.27 GHz plotted on top of an AIA 131 Å (left) and 1600 Å (right) filtergram for the event on October 11, 2021. The color code for the different EOVSA frequencies is the same in both images. The contours in the left panel are 20, 50, and 70% of the maximum intensity; in the right panel, we have 50 and 70%.
Current usage metrics show cumulative count of Article Views (full-text article views including HTML views, PDF and ePub downloads, according to the available data) and Abstracts Views on Vision4Press platform.
Data correspond to usage on the plateform after 2015. The current usage metrics is available 48-96 hours after online publication and is updated daily on week days.
Initial download of the metrics may take a while.