Fig. 5.
Download original image
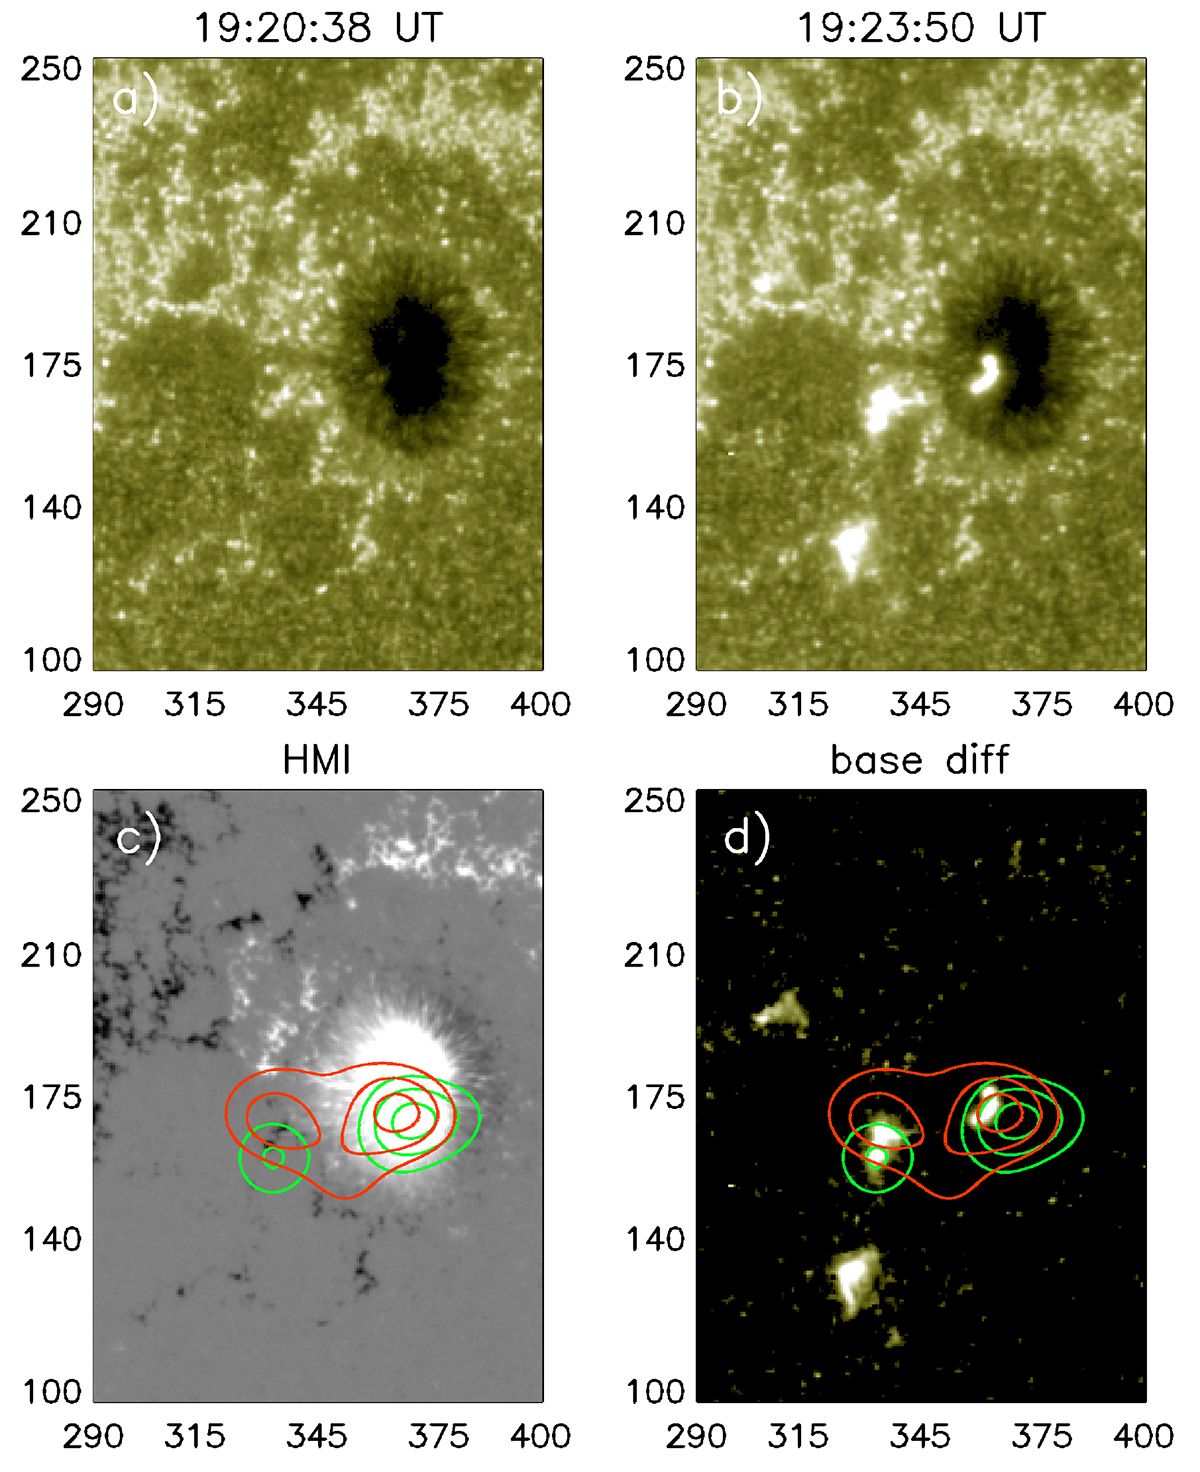
Chromospheric response and magnetograms. AIA 1600 Å images (panels a, b), HMI LOS magnetogram (c) and 1600 Å difference image (d) for October 11, 2021. Green contours show the STIX image in the 16−28 keV energy range, red in 4−8 keV (30, 60, 90% of the maximum intensity). The HMI image is scaled from −700 to +700 G. Units are given in arcseconds. Integration times are 19:23:21–19:24:36 UT for the non-thermal and 19:24:51–19:26:31 UT for the thermal image, respectively.
Current usage metrics show cumulative count of Article Views (full-text article views including HTML views, PDF and ePub downloads, according to the available data) and Abstracts Views on Vision4Press platform.
Data correspond to usage on the plateform after 2015. The current usage metrics is available 48-96 hours after online publication and is updated daily on week days.
Initial download of the metrics may take a while.