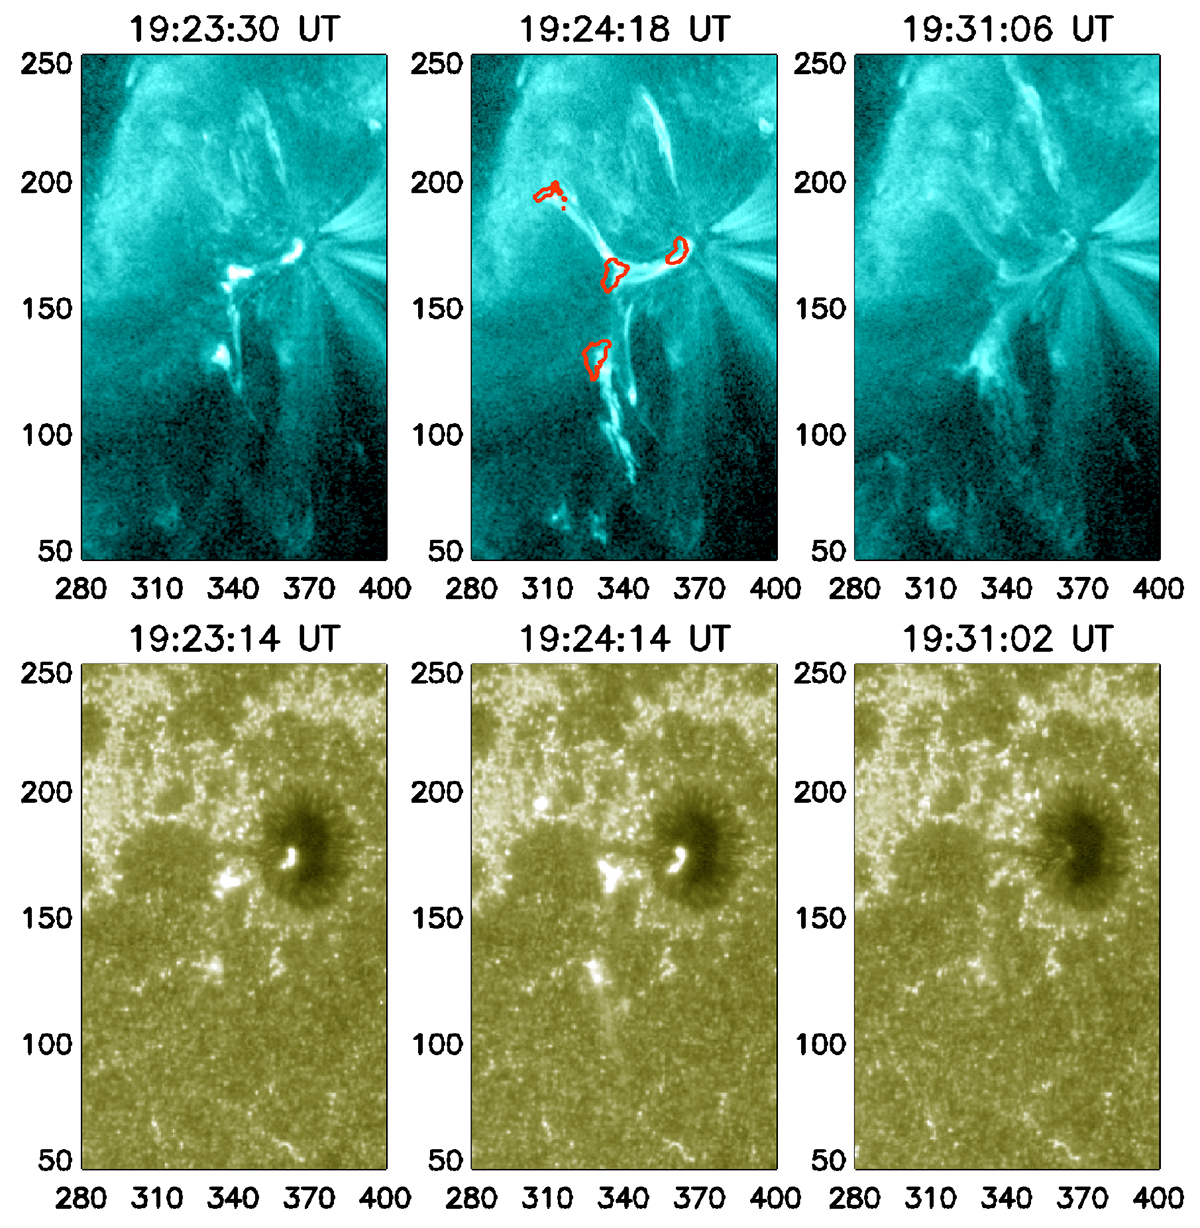
Fig. 4.
Download original image
Overview at EUV and UV wavelengths. AIA 131 Å filtergrams over the course of the flare on October 11, 2021 (top) and AIA 1600 Å filtergrams (bottom). Red contours in the top middle panel show footpoint locations derived from the AIA 1600 Å base difference image shown in Fig. 5. Units are given in arcseconds. An animated version of this figure is included online.
Current usage metrics show cumulative count of Article Views (full-text article views including HTML views, PDF and ePub downloads, according to the available data) and Abstracts Views on Vision4Press platform.
Data correspond to usage on the plateform after 2015. The current usage metrics is available 48-96 hours after online publication and is updated daily on week days.
Initial download of the metrics may take a while.