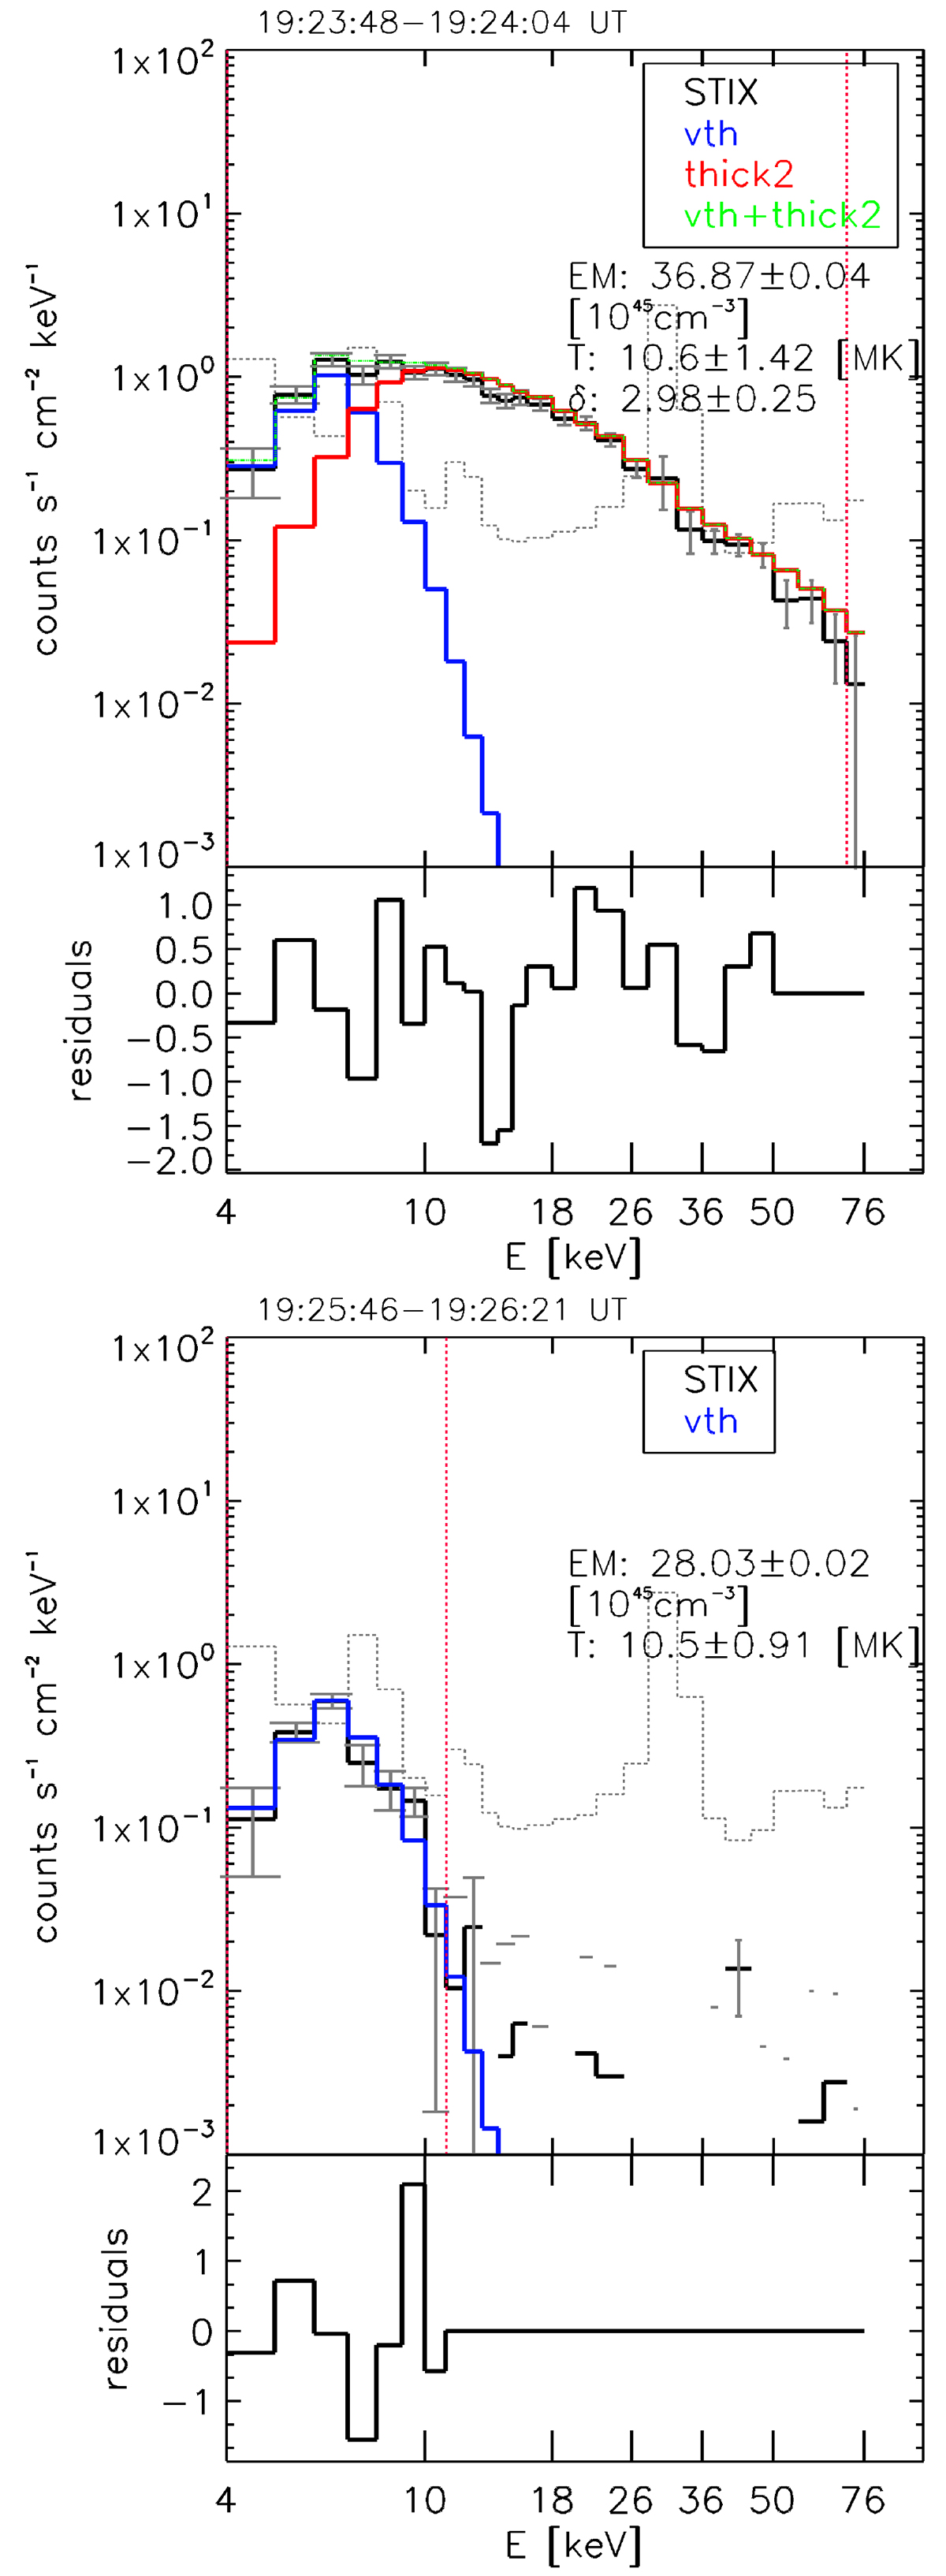
Fig. 3.
Download original image
X-ray spectroscopy. Background-subtracted STIX count spectra (black) and best fit (green) from the sum of an isothermal (blue) and a thick target (red) component for October 11, 2021 during the peak (top panel) and decay (bottom panel) phase. Gray vertical lines on the data points indicate the error bars of the count rate. The gray dashed line shows the preflare background spectrum. The red vertical lines show the energy range considered in the fitting. Integration times for the spectral fitting are indicated by gray lines in the top panel of Fig. 2.
Current usage metrics show cumulative count of Article Views (full-text article views including HTML views, PDF and ePub downloads, according to the available data) and Abstracts Views on Vision4Press platform.
Data correspond to usage on the plateform after 2015. The current usage metrics is available 48-96 hours after online publication and is updated daily on week days.
Initial download of the metrics may take a while.