Fig. 1.
Download original image
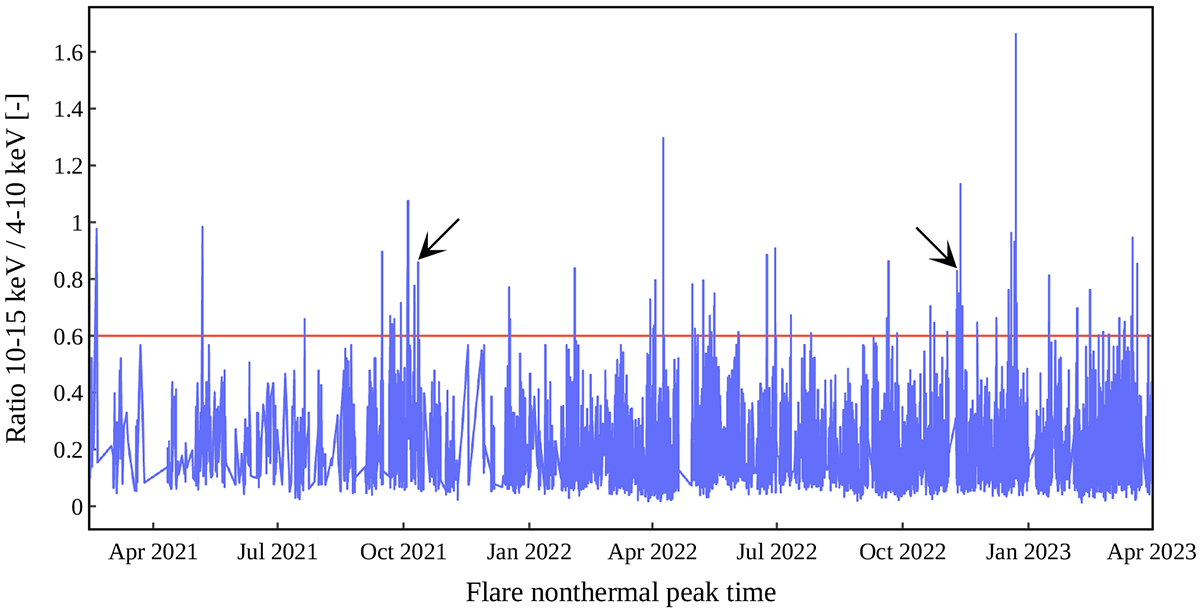
Ratio of STIX QL counts in the (10−15) to the (4−10) keV energy bands during the nonthermal flare peak times for the period March 2021 to April 2023. The red horizontal line indicates the 0.6 threshold. The arrows show the events under study.
Current usage metrics show cumulative count of Article Views (full-text article views including HTML views, PDF and ePub downloads, according to the available data) and Abstracts Views on Vision4Press platform.
Data correspond to usage on the plateform after 2015. The current usage metrics is available 48-96 hours after online publication and is updated daily on week days.
Initial download of the metrics may take a while.