Fig. 10.
Download original image
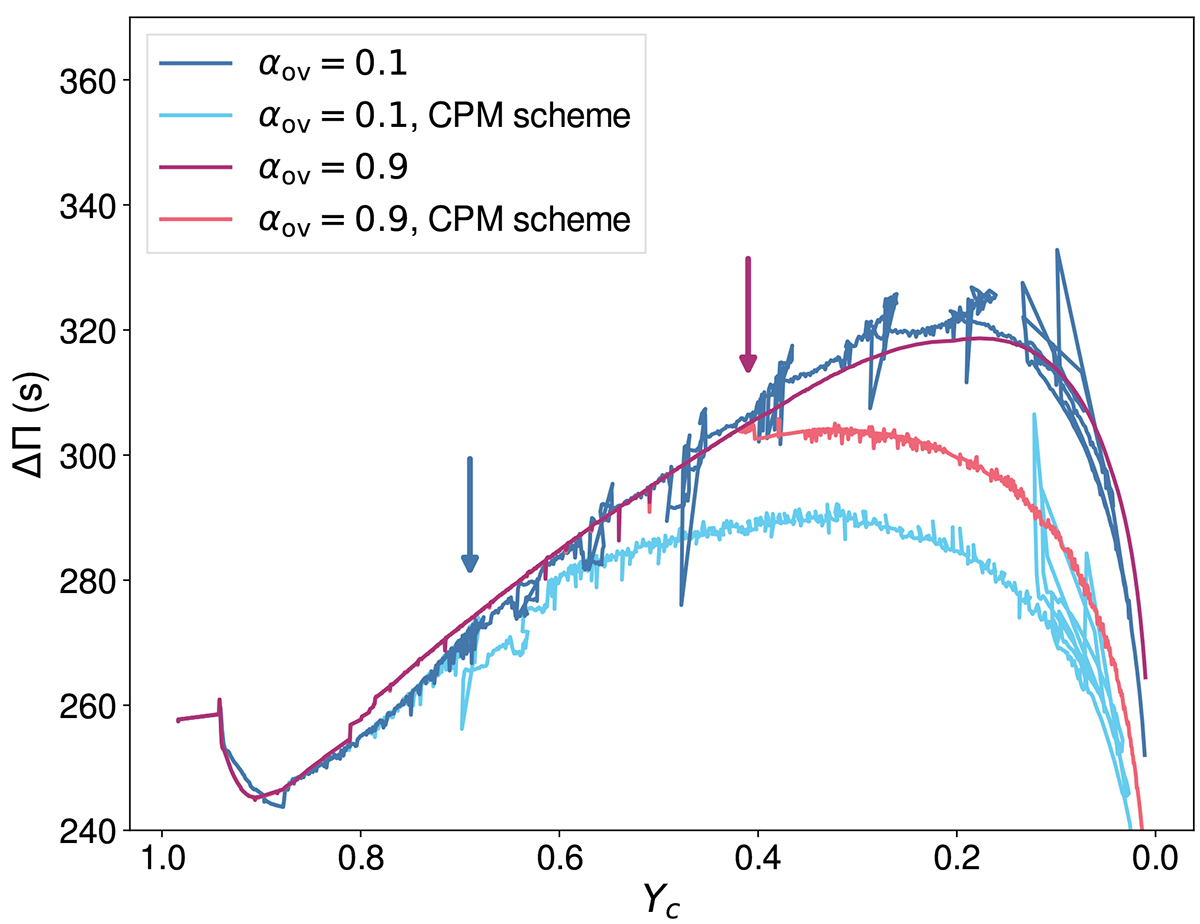
Evolution of the asymptotic period spacing for overmixing models with αov = 0.1 (blue) and αov = 0.9 (pink), computed with the default core boundary scheme (dark colors) and the CPM scheme (light colors; see text for details). The arrows indicate the moment in the evolution at which a semiconvective region appears. Strong episodes of CBP are visible in the low-overshoot models for Yc < 0.15.
Current usage metrics show cumulative count of Article Views (full-text article views including HTML views, PDF and ePub downloads, according to the available data) and Abstracts Views on Vision4Press platform.
Data correspond to usage on the plateform after 2015. The current usage metrics is available 48-96 hours after online publication and is updated daily on week days.
Initial download of the metrics may take a while.