Fig. 5.
Download original image
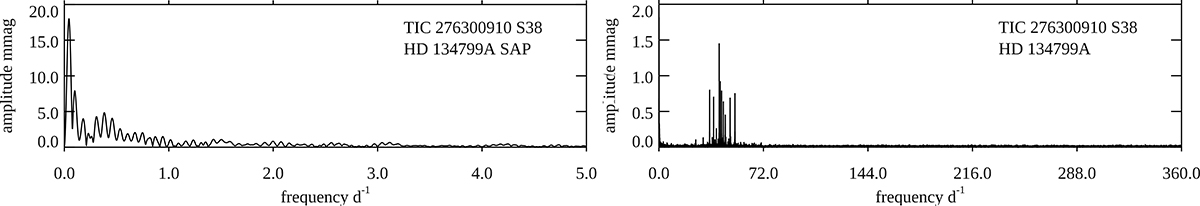
Amplitude spectra for TIC 276300910 (HD 134799) show clear rotation in the S11 and S38 SAP data with ![]() . The low-frequency amplitude spectrum shown here is for the SAP data. This star shows rich multi-periodic δ Sct pulsations, but those probably arise in TIC 276300912 (HD 134799B) which is an A5 star unresolved from TIC 276300910 in the TESS photometry.
. The low-frequency amplitude spectrum shown here is for the SAP data. This star shows rich multi-periodic δ Sct pulsations, but those probably arise in TIC 276300912 (HD 134799B) which is an A5 star unresolved from TIC 276300910 in the TESS photometry.
Current usage metrics show cumulative count of Article Views (full-text article views including HTML views, PDF and ePub downloads, according to the available data) and Abstracts Views on Vision4Press platform.
Data correspond to usage on the plateform after 2015. The current usage metrics is available 48-96 hours after online publication and is updated daily on week days.
Initial download of the metrics may take a while.