Open Access
Fig. 9
Download original image
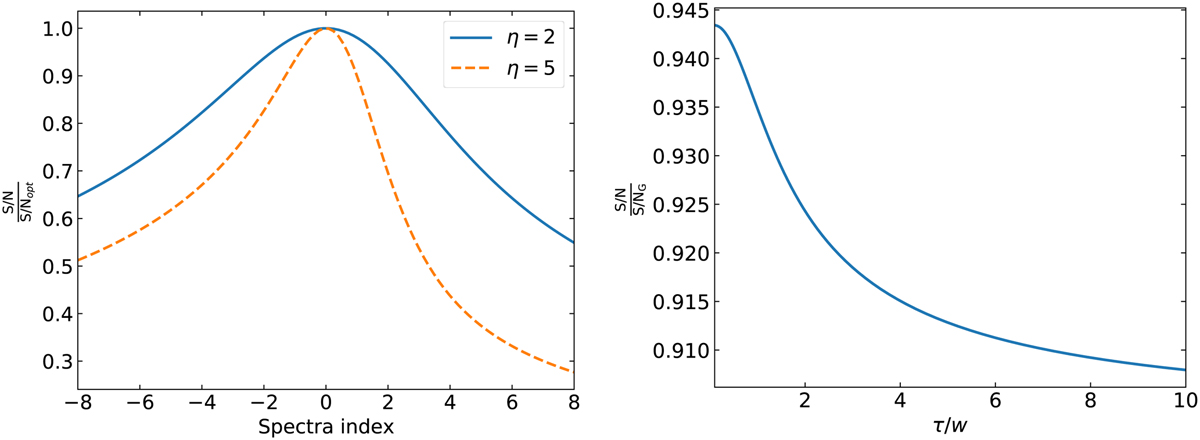
Curves of the decrease in S/N. The left panel illustrates the S/N decrease with a mismatch in the spectral index when η = 2 and η = 5. The right panel depicts the S/N decrease with a mismatch in the pulse shape between a boxcar shape and a Gaussian shape with scattering.
Current usage metrics show cumulative count of Article Views (full-text article views including HTML views, PDF and ePub downloads, according to the available data) and Abstracts Views on Vision4Press platform.
Data correspond to usage on the plateform after 2015. The current usage metrics is available 48-96 hours after online publication and is updated daily on week days.
Initial download of the metrics may take a while.