Fig. 8
Download original image
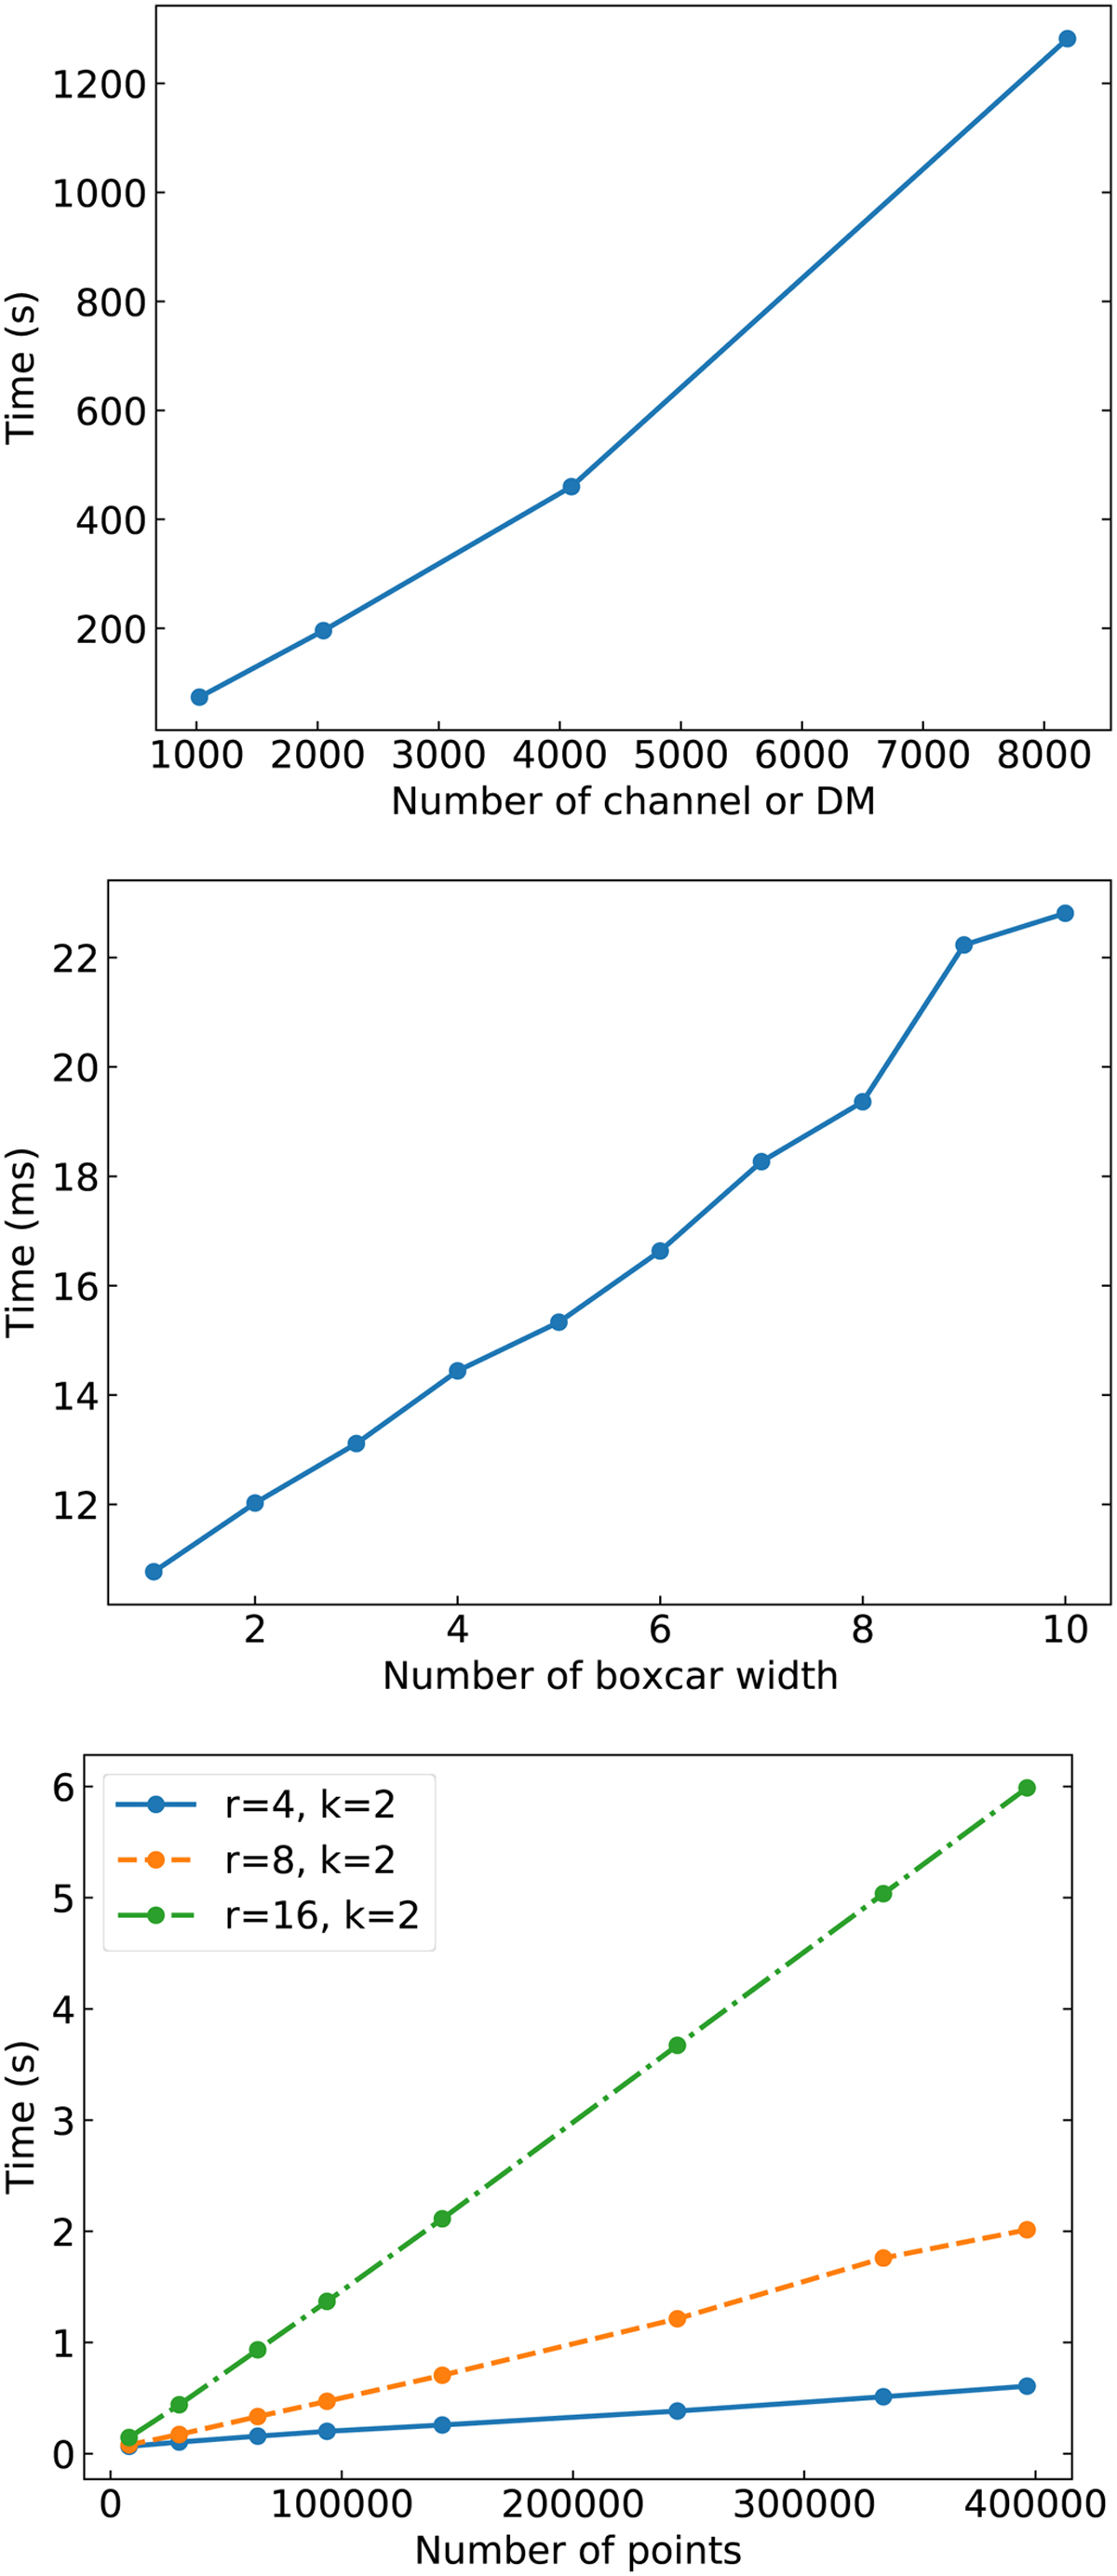
Benchmark results for dedispersion, matched filtering, and clustering. The top panel depicts the relation between the dedispersion time cost and the number of frequency channels, which is equivalent to the number of DM trials. It demonstrates the efficiency of the dedispersion process. The middle panel shows the relation between the matched-filter time cost per DM trial and the number of boxcar widths. The linear scalability of the matched-filter process with respect to the number of boxcar widths is evident. The bottom panel illustrates how the clustering time scales with the number of points and is affected by the choice of radius, where the solid blue, dashed orange, and dash-dotted green lines represent a radius r 4, 8, and 16 in units of the samples, respectively.
Current usage metrics show cumulative count of Article Views (full-text article views including HTML views, PDF and ePub downloads, according to the available data) and Abstracts Views on Vision4Press platform.
Data correspond to usage on the plateform after 2015. The current usage metrics is available 48-96 hours after online publication and is updated daily on week days.
Initial download of the metrics may take a while.