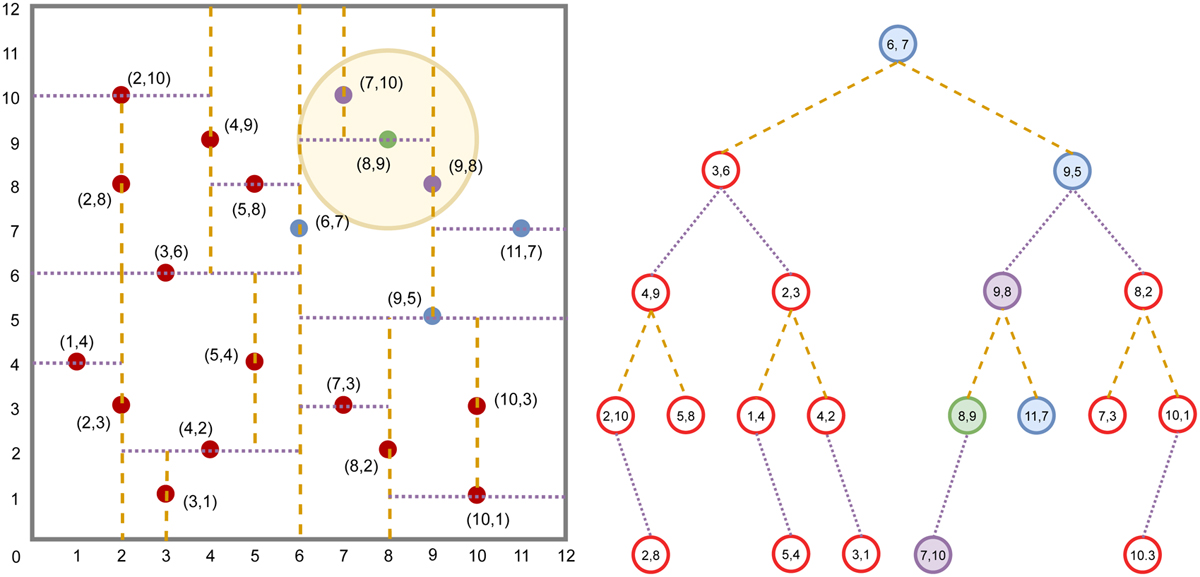
Fig. 6
Download original image
Neighbor-finding algorithm using a kd-tree. The example demonstrates the process of finding neighboring points within a radius of r = 2 around a point (8, 9), denoted by a green circle. The left panel displays the plane divisions created by the points on the kd-tree. The dashed yellow and dotted purple lines divide the plane vertically and horizontally, respectively. The shaded yellow area represents the region within a radius of r = 2 from the point (8, 9). The right panel illustrates the kd-tree structure employed to identify neighboring points around the point (8, 9). The red circles indicate points that are not traversed, and the other circles represent points that are traversed. The purple points highlight the neighboring points found within the radius of r = 2.
Current usage metrics show cumulative count of Article Views (full-text article views including HTML views, PDF and ePub downloads, according to the available data) and Abstracts Views on Vision4Press platform.
Data correspond to usage on the plateform after 2015. The current usage metrics is available 48-96 hours after online publication and is updated daily on week days.
Initial download of the metrics may take a while.