Open Access
Fig. 3
Download original image
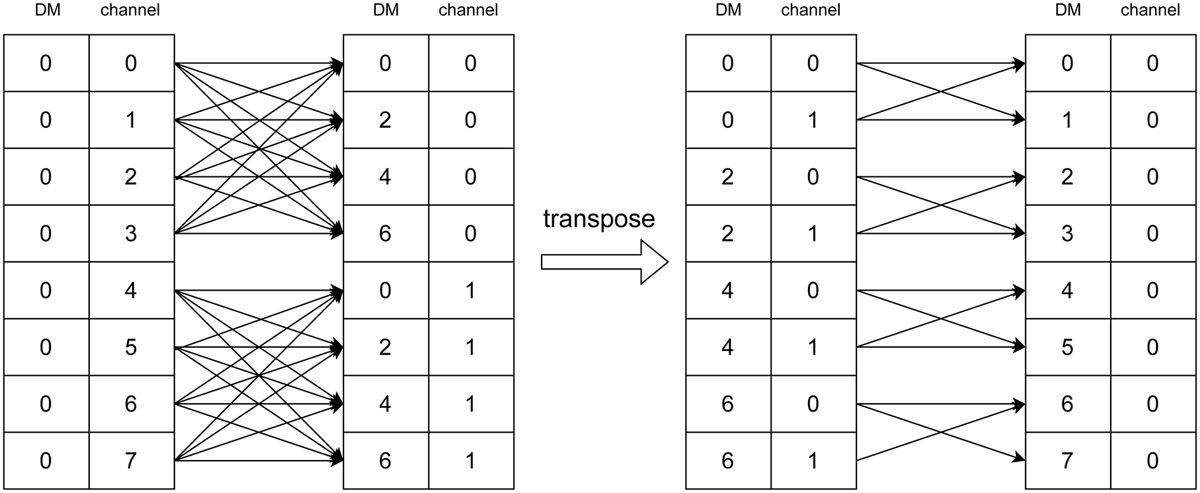
Example sub-band dedispersion diagram with eight channels and DM trials. It presents the two stages of the sub-band dedispersion: (1) Dedispersing the data into sub-bands with a coarser DM grid. (2) Dedispersing the sub-banded data with a finer DM grid.
Current usage metrics show cumulative count of Article Views (full-text article views including HTML views, PDF and ePub downloads, according to the available data) and Abstracts Views on Vision4Press platform.
Data correspond to usage on the plateform after 2015. The current usage metrics is available 48-96 hours after online publication and is updated daily on week days.
Initial download of the metrics may take a while.