Fig. 2
Download original image
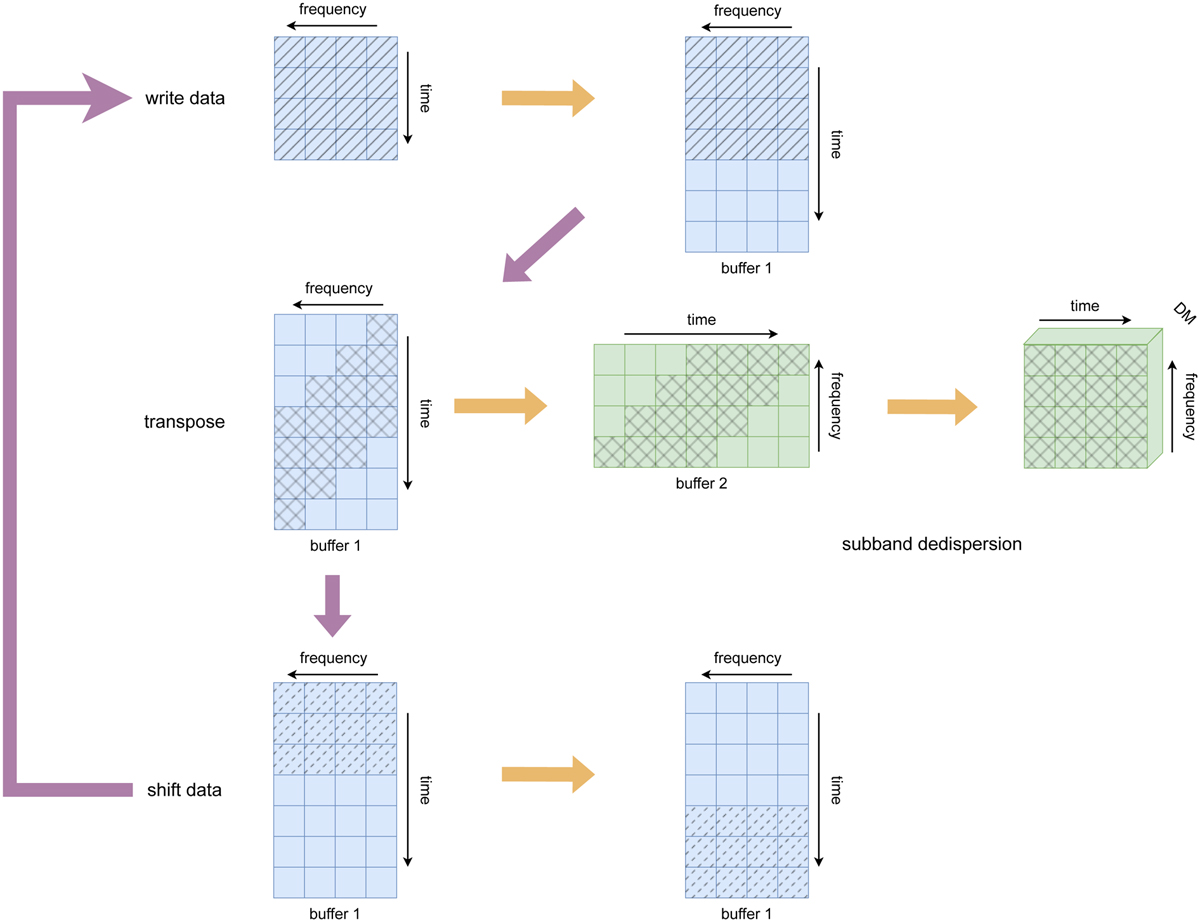
Data-flow diagram for dedispersion, incorporating the stages of “write data,” “transpose,” “sub-band dedispersion,” and “shift data.” In this diagram, green memory blocks are used to buffer incoming data, and blue blocks serve as buffers for transposed data, where the dedispersion process takes place. The shaded patterns within the diagram illustrate the data mapping at various steps: (1) In the “write data” step, the shaded pattern represents the positions where the input data are written. (2) In the “transpose” step, the shaded pattern illustrates how the dedispersed data are transposed in buffers 1 and 2. (3) In the “sub-band dedispersion” step, the shaded pattern represents the dedispersion of the data. (4) In the “shift data” step, the shaded pattern illustrates the mapping of the data as they are shifted.
Current usage metrics show cumulative count of Article Views (full-text article views including HTML views, PDF and ePub downloads, according to the available data) and Abstracts Views on Vision4Press platform.
Data correspond to usage on the plateform after 2015. The current usage metrics is available 48-96 hours after online publication and is updated daily on week days.
Initial download of the metrics may take a while.