Open Access
Fig. E.1.
Download original image
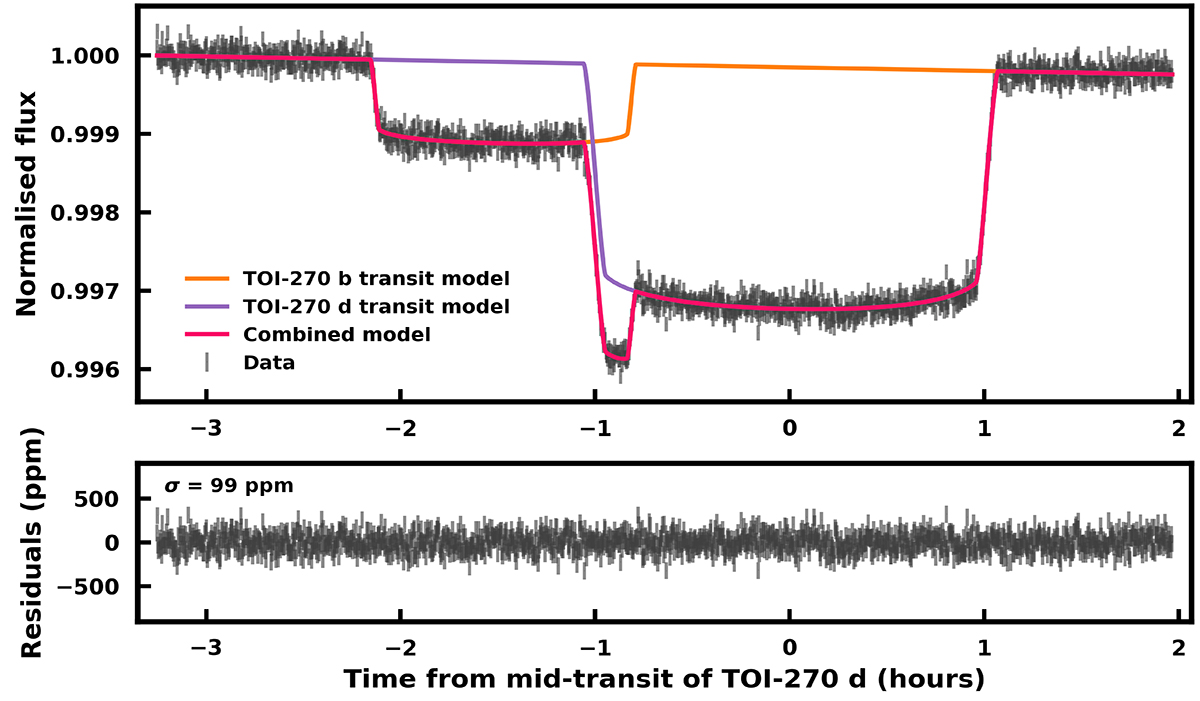
Simultaneous model fit of the transits of TOI-270 b and d. The top panel shows the combined white light curve from NRS1 and NRS2, together with the best-fit models. The bottom panel shows the residuals after subtracting the best-fit combined model. The standard deviation of the residuals is 99 ppm.
Current usage metrics show cumulative count of Article Views (full-text article views including HTML views, PDF and ePub downloads, according to the available data) and Abstracts Views on Vision4Press platform.
Data correspond to usage on the plateform after 2015. The current usage metrics is available 48-96 hours after online publication and is updated daily on week days.
Initial download of the metrics may take a while.