Fig. 8
Download original image
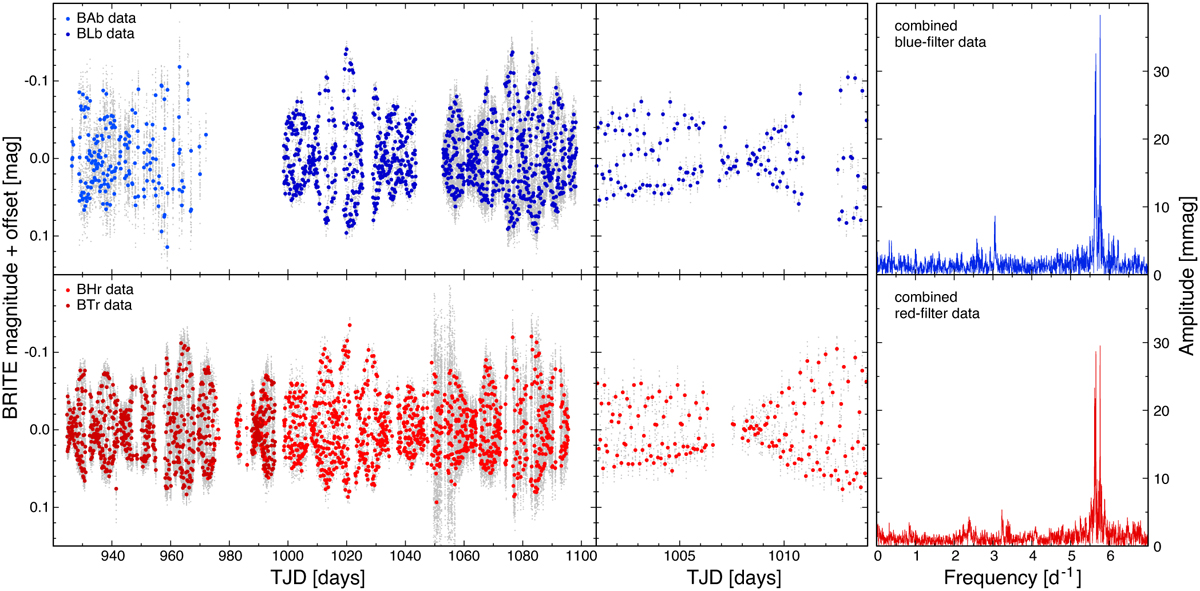
BRITE-Constellation observations of the β Cephei pulsator HD 29248 (ν Eri) in Field 6. Top panels show observations gathered by the blue-filter satellites, BAb and BLb, and bottom panels observations with the red-filter satellites, BHr and BTr. Left panels show the full light curve, the middle panels illustrate a 13-day-long subset of the light curve, and the right panels display the FSa of the combined blue- and red-filter data. Grey dots are the decorrelated data points, while the red and blue points mark the mean instrumental magnitudes per orbit.
Current usage metrics show cumulative count of Article Views (full-text article views including HTML views, PDF and ePub downloads, according to the available data) and Abstracts Views on Vision4Press platform.
Data correspond to usage on the plateform after 2015. The current usage metrics is available 48-96 hours after online publication and is updated daily on week days.
Initial download of the metrics may take a while.