Fig. 3
Download original image
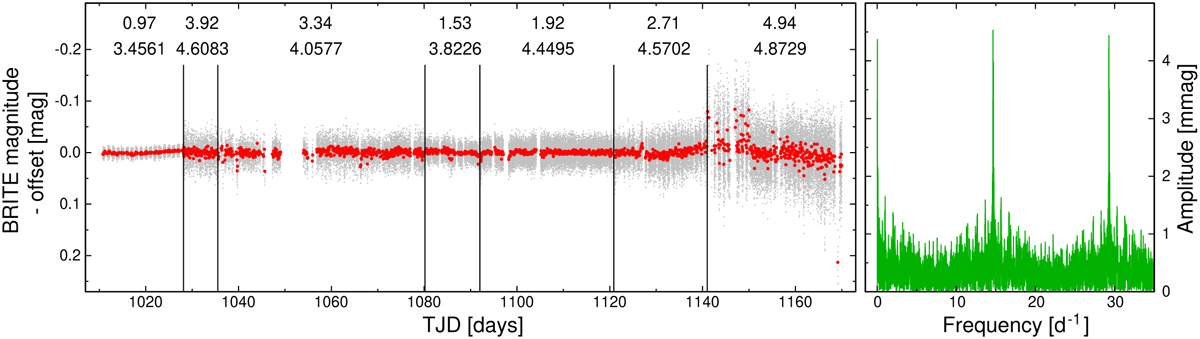
Light curve (left) of the merged BTr Field 7 data of HD 74180 (b Vel) and its Fourier spectrum (FS; right). The red points in the light curve mark the mean instrumental magnitudes per orbit. Vertical lines separate individual setups that were processed separately during decorrelations. The two numbers above each setup show the values of ![]() (see Sect. 2.5) in mmag (top number) and subtracted offsets in mag (bottom number). The light curve illustrates some instrumental effects, such as a different amount of scatter, gaps in data, offsets, and long-term trends. These effects result in the presence of very low frequencies in the FS reproduced close to the satellite’s orbital frequency of 14.66 d−1 and its multiples.
(see Sect. 2.5) in mmag (top number) and subtracted offsets in mag (bottom number). The light curve illustrates some instrumental effects, such as a different amount of scatter, gaps in data, offsets, and long-term trends. These effects result in the presence of very low frequencies in the FS reproduced close to the satellite’s orbital frequency of 14.66 d−1 and its multiples.
Current usage metrics show cumulative count of Article Views (full-text article views including HTML views, PDF and ePub downloads, according to the available data) and Abstracts Views on Vision4Press platform.
Data correspond to usage on the plateform after 2015. The current usage metrics is available 48-96 hours after online publication and is updated daily on week days.
Initial download of the metrics may take a while.