Fig. 9
Download original image
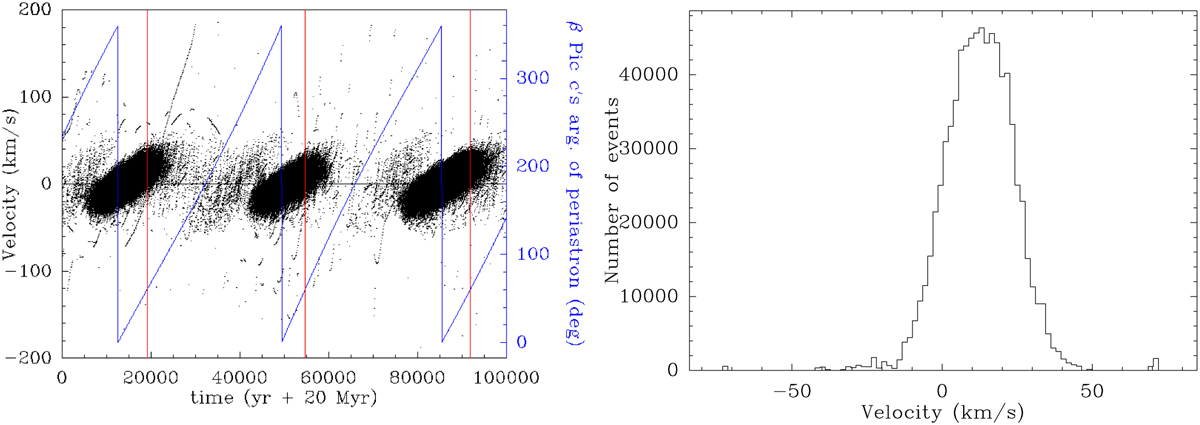
Statistical description of the simulated FEB spectral events generated from the simulation described in Fig. 4, and corresponding to solution #2 from Table 1. Left: Doppler velocities of the FEB events occurring in the first 105 yr after the end of the simulation. The velocity scale is on the left side of the plot; positive velocities correspond to redshifts. The simultaneous evolution of β Pic c’s argument of periastron ωc,sky (see text) is superimposed in blue, with the corresponding scale in blue on the right side of the plot. The red bars highlight epochs where ωc,sky matches the fitted value from Table 1. Right: histogram of FEB velocities occurring ±100 yr around epochs corresponding to the red bars.
Current usage metrics show cumulative count of Article Views (full-text article views including HTML views, PDF and ePub downloads, according to the available data) and Abstracts Views on Vision4Press platform.
Data correspond to usage on the plateform after 2015. The current usage metrics is available 48-96 hours after online publication and is updated daily on week days.
Initial download of the metrics may take a while.