Fig. 6
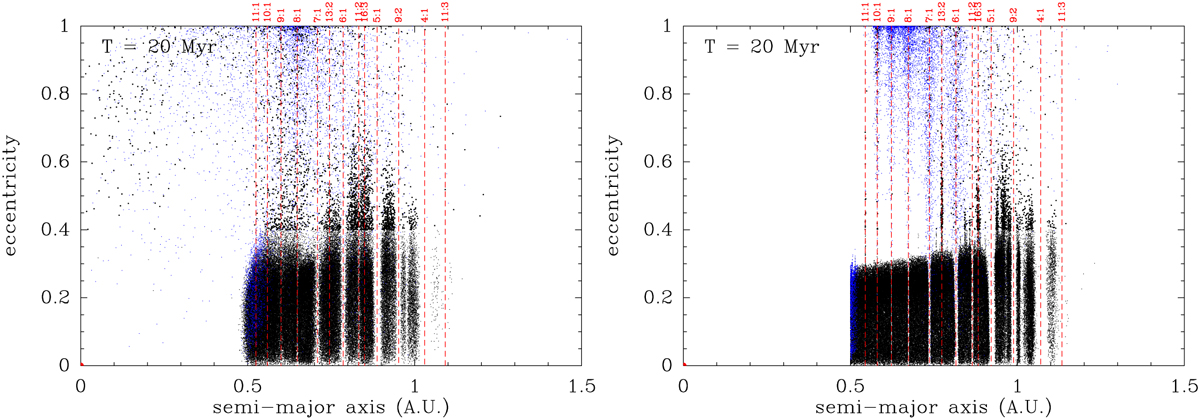
Download original image
Same as Figs. 4 and 5 at t = 20 Myr, but taking into account gradual evaporation of FEBs, with solution #2 (left plot) and #1 (right plot) from Table 1. All particles appearing in blue are virtually already evaporated and should not account for the FEB statistics at that time. The locations of the main MMRs with β Pic c are indicated with red vertical bars.
Current usage metrics show cumulative count of Article Views (full-text article views including HTML views, PDF and ePub downloads, according to the available data) and Abstracts Views on Vision4Press platform.
Data correspond to usage on the plateform after 2015. The current usage metrics is available 48-96 hours after online publication and is updated daily on week days.
Initial download of the metrics may take a while.