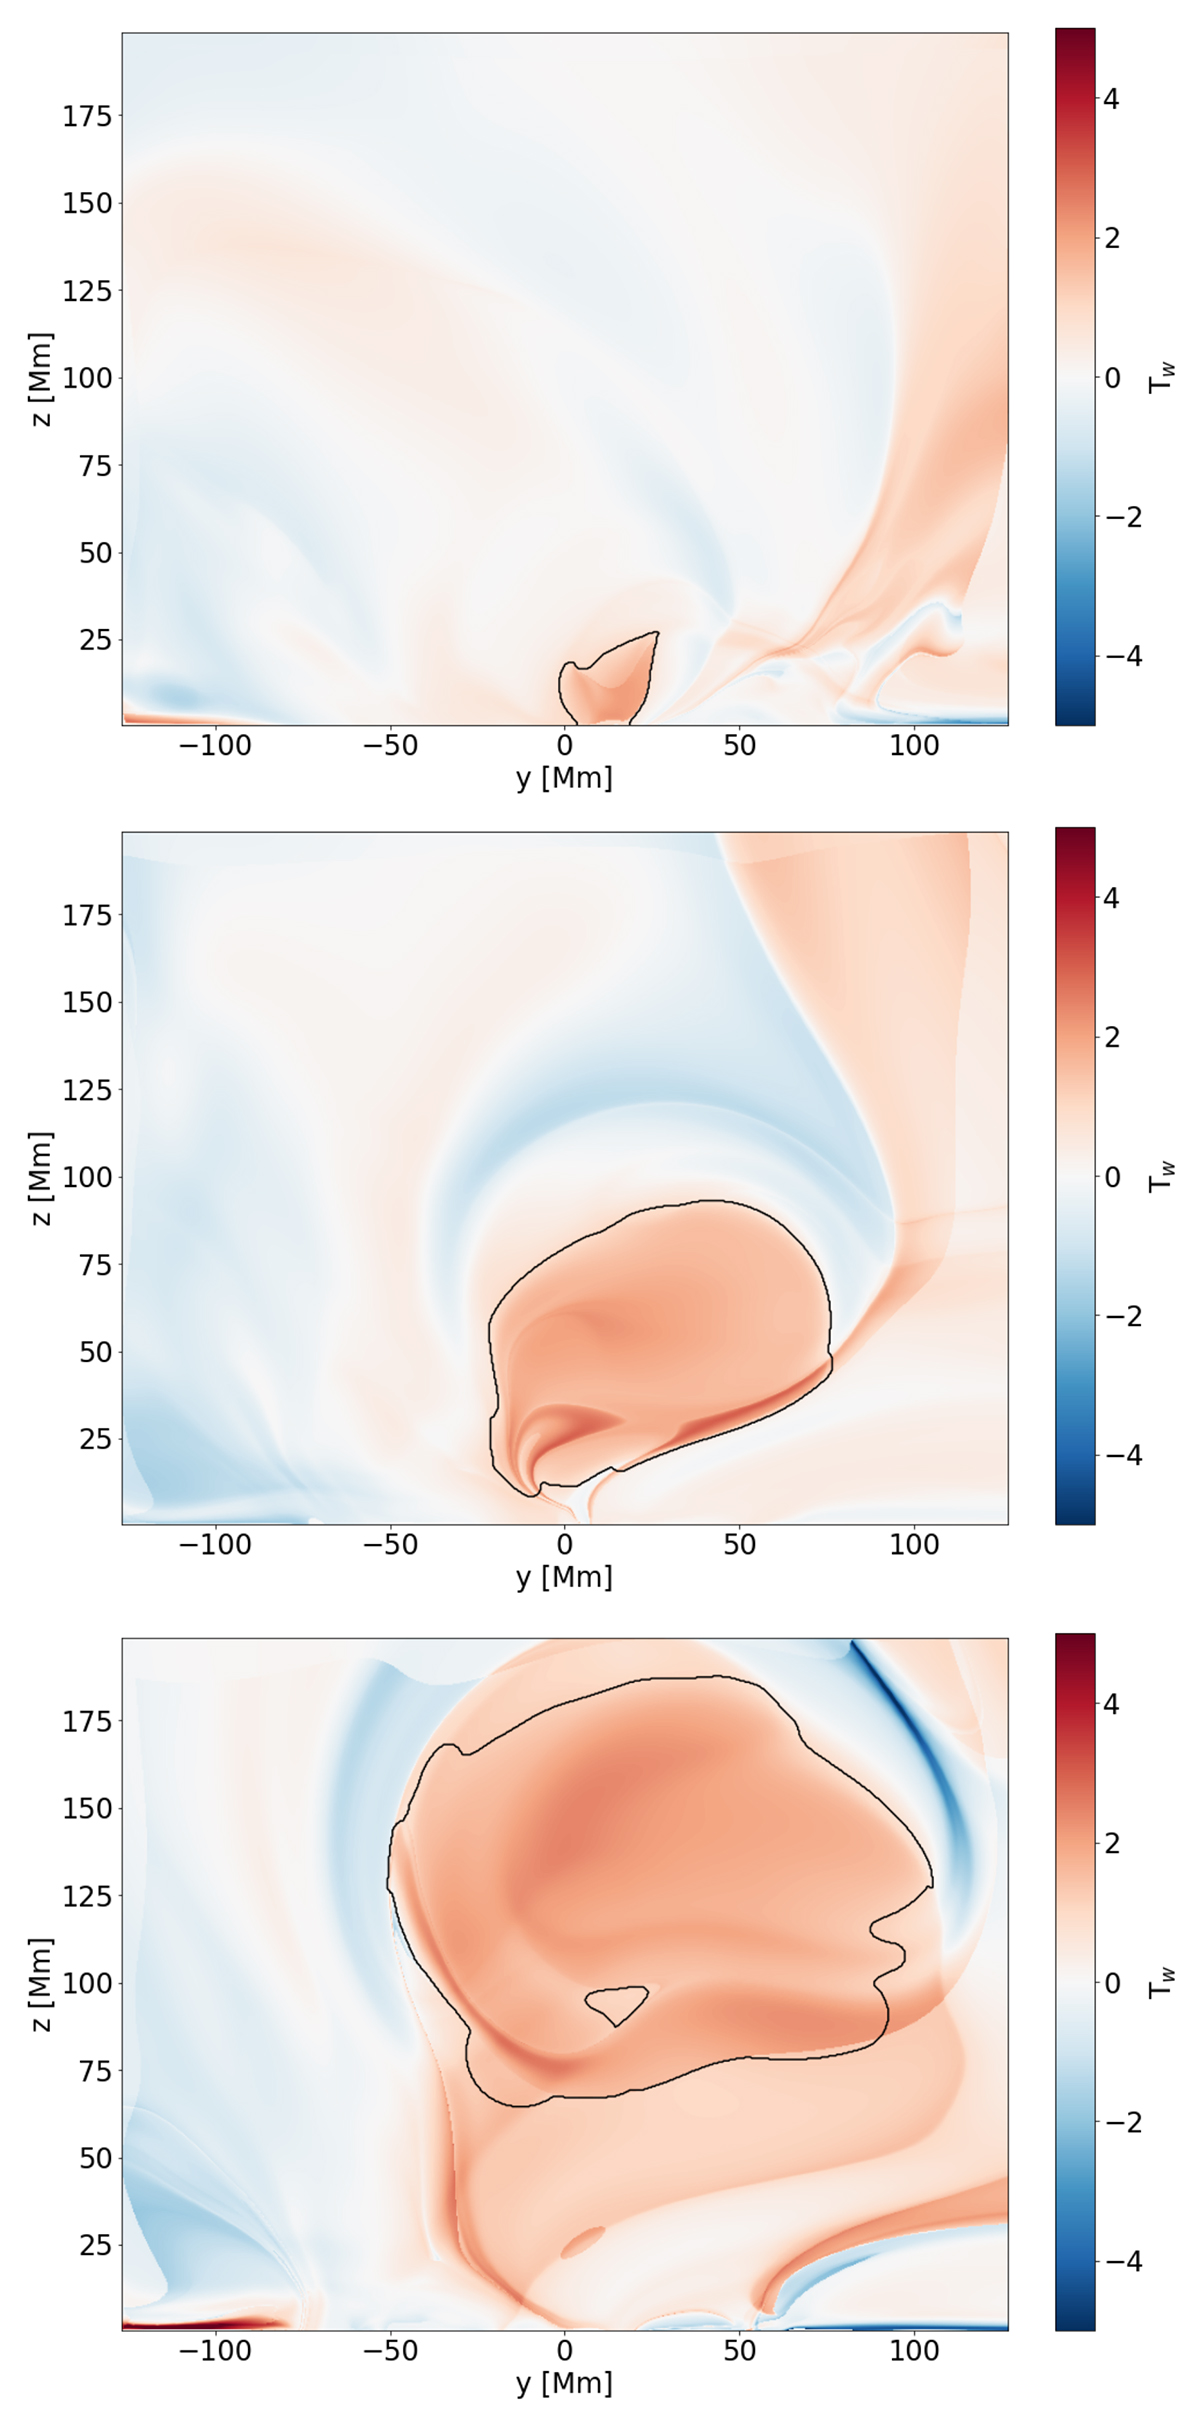
Fig. 1.
Download original image
Twist map evolution for AR12473. The colour intensity indicates the magnitude of twist, where blue indicates negative twist and red indicates positive twist. The snapshots shown correspond to simulation frame numbers 7, 17, and 27 (from top to bottom). The shape identified as belonging to the FR is marked with a black contour. A movie is available online.
Current usage metrics show cumulative count of Article Views (full-text article views including HTML views, PDF and ePub downloads, according to the available data) and Abstracts Views on Vision4Press platform.
Data correspond to usage on the plateform after 2015. The current usage metrics is available 48-96 hours after online publication and is updated daily on week days.
Initial download of the metrics may take a while.