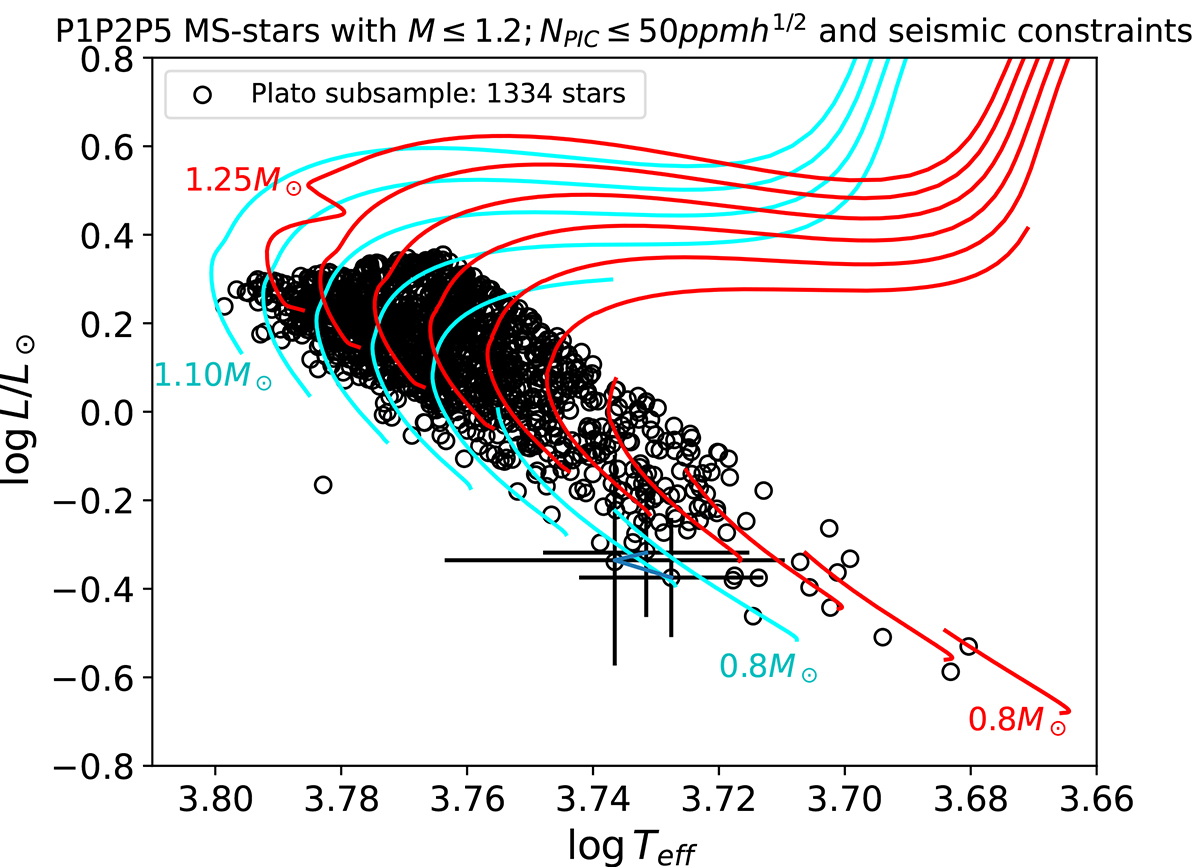
Fig. 8.
Download original image
P1, P2, P5 stars with M ≤ 1.2 M⊙, NPIC ≤ 50 ppm h1/2 and satisfying constraint of case II in Table 6. Crosses indicate the (representative) PIC uncertainties for three target stars. Evolutionary tracks of stellar models built with a given initial chemical composition and αMLT value are represented by the same color: cyan (αMLT = 1.845, Y0 = 25, (Z/X)0 = 0.0136, no atomic diffusion included, masses in the range [0.8–1.10] M⊙ in steps of 0.05 M⊙) or red (αMLT = 1.642, Y0 = 0.25, (Z/X)0 = 0.0246, atomic diffusion included, masses in the range [0.8–1.25] M⊙ in steps of 0.05 M⊙).
Current usage metrics show cumulative count of Article Views (full-text article views including HTML views, PDF and ePub downloads, according to the available data) and Abstracts Views on Vision4Press platform.
Data correspond to usage on the plateform after 2015. The current usage metrics is available 48-96 hours after online publication and is updated daily on week days.
Initial download of the metrics may take a while.