Fig. 5.
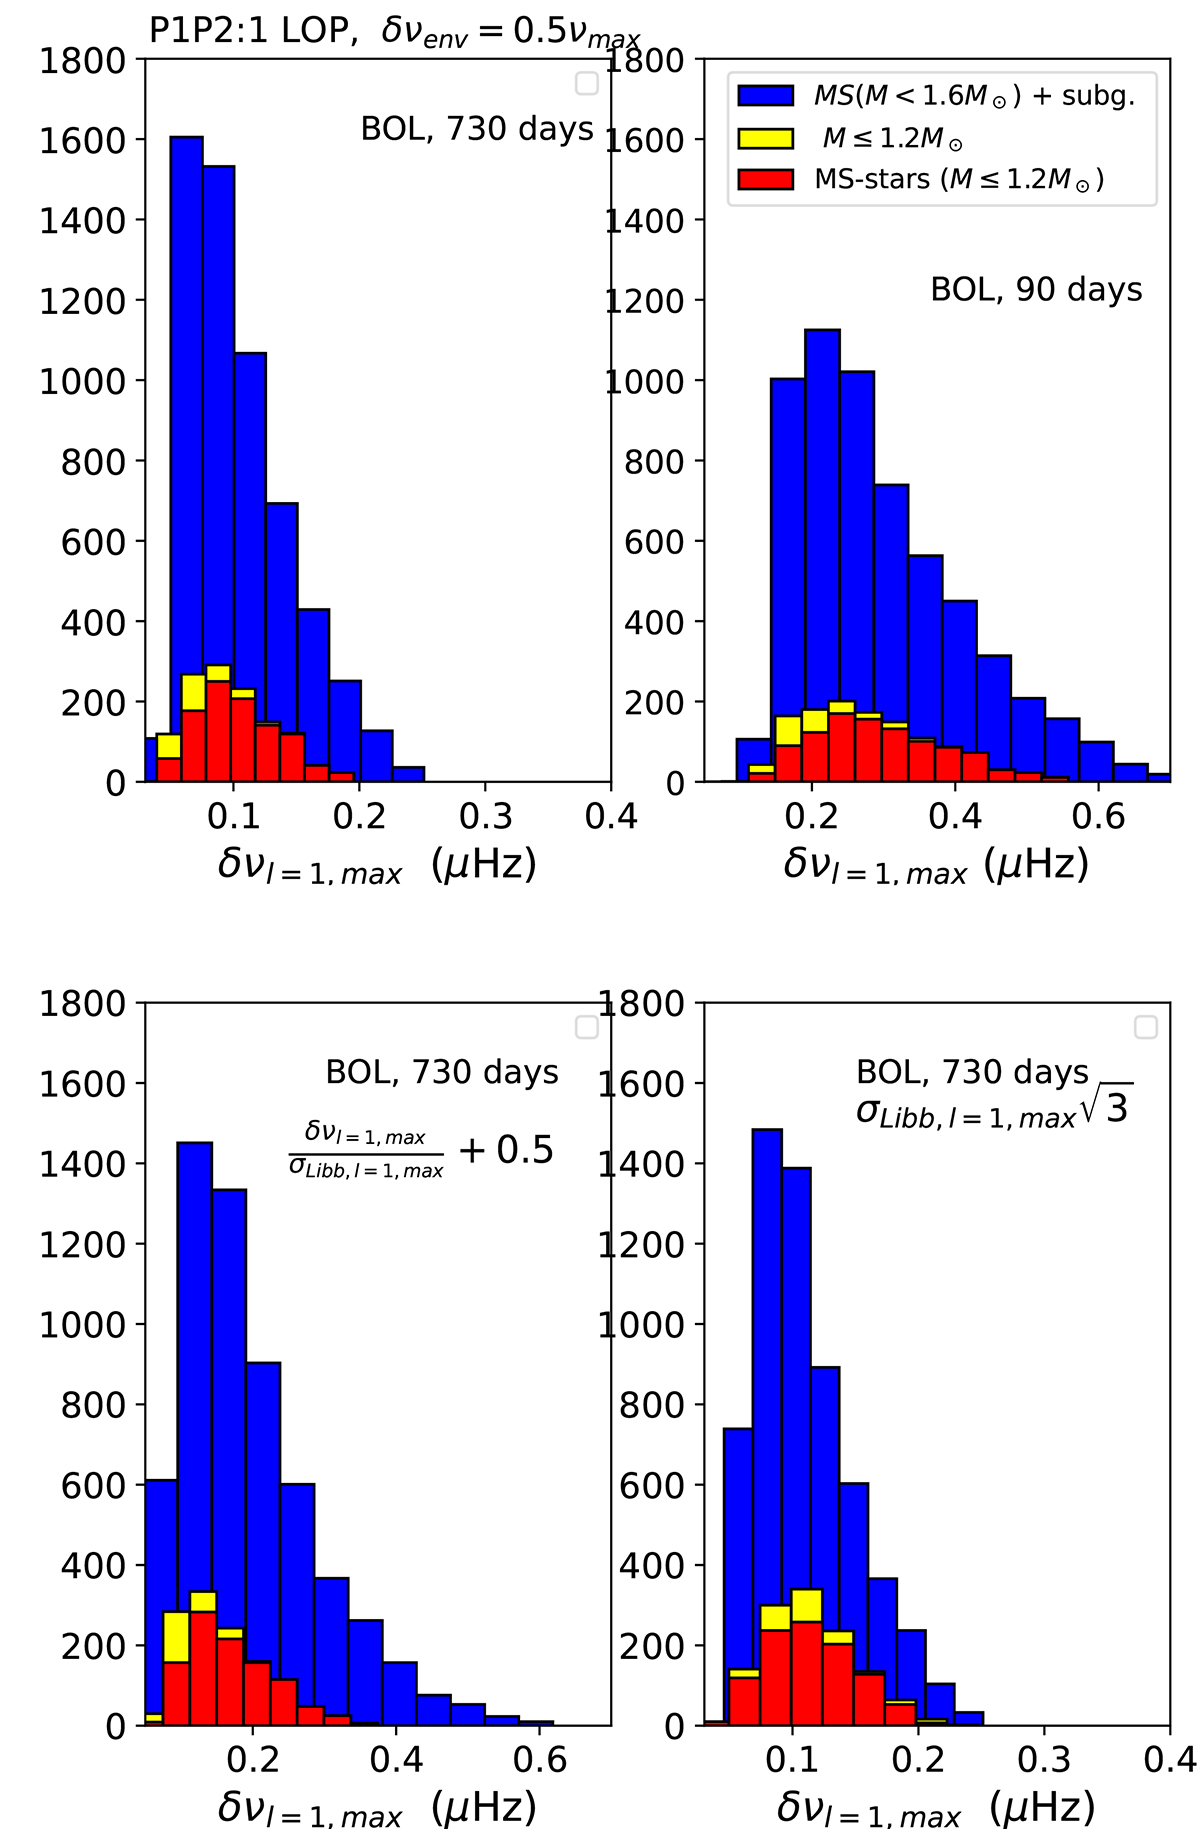
Download original image
Distribution of frequency uncertainties δνℓ = 1, max for the sample of P1P2 stars with expected positive seismic detection. The color code corresponds to different mass samples as indicated in the top right panel. The top panels correspond to the frequency uncertainties computed with Eq. (20) for observation lengths of 730 days (top-left panel) and 90 days (top-right panel). The bottom panels show the frequency uncertainties distribution when one takes into account the scatter in the relation obtained with Eq. (20) (left panel) or the uncertainties in the mode linewidths at low effective temperature width, as per Appendix D (right panel).
Current usage metrics show cumulative count of Article Views (full-text article views including HTML views, PDF and ePub downloads, according to the available data) and Abstracts Views on Vision4Press platform.
Data correspond to usage on the plateform after 2015. The current usage metrics is available 48-96 hours after online publication and is updated daily on week days.
Initial download of the metrics may take a while.