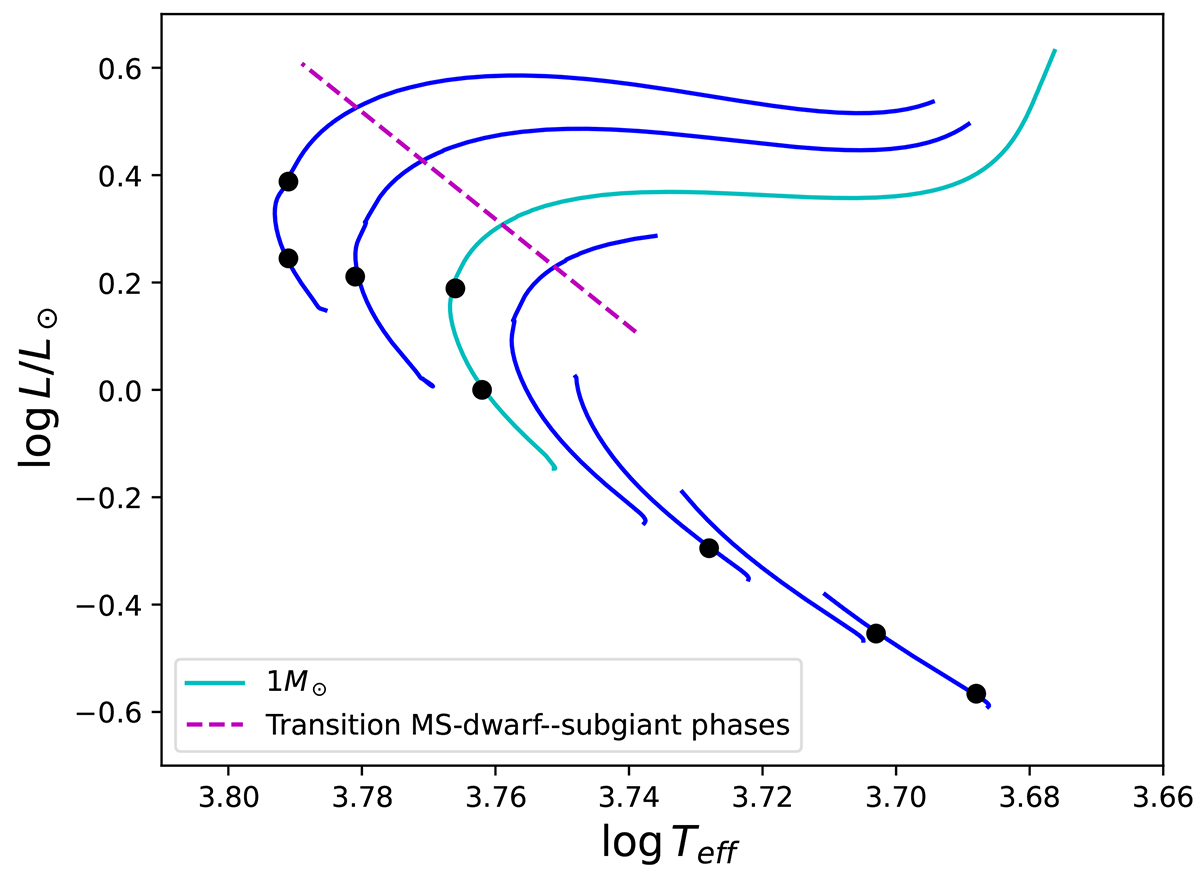
Fig. C.1.
Download original image
Evolutionary tracks for masses from 0.8 to 1.15 M⊙ in step of 0.05 M⊙ (blue solid curves) in a HR diagram. The black dots indicate the location of the synthetic targets stars studied here. The magenta dashed line shows the location of models with their central hydrogen content Xc ∼ 10−6 which we take here as the transition between MS stars and subgiant phases. The transition follows the empirical relation : log L/L⊙ = 10 (log Teff − 3.7532)+0.25 for that range of mass given the adopted chemical composition and physics of the stellar models.
Current usage metrics show cumulative count of Article Views (full-text article views including HTML views, PDF and ePub downloads, according to the available data) and Abstracts Views on Vision4Press platform.
Data correspond to usage on the plateform after 2015. The current usage metrics is available 48-96 hours after online publication and is updated daily on week days.
Initial download of the metrics may take a while.