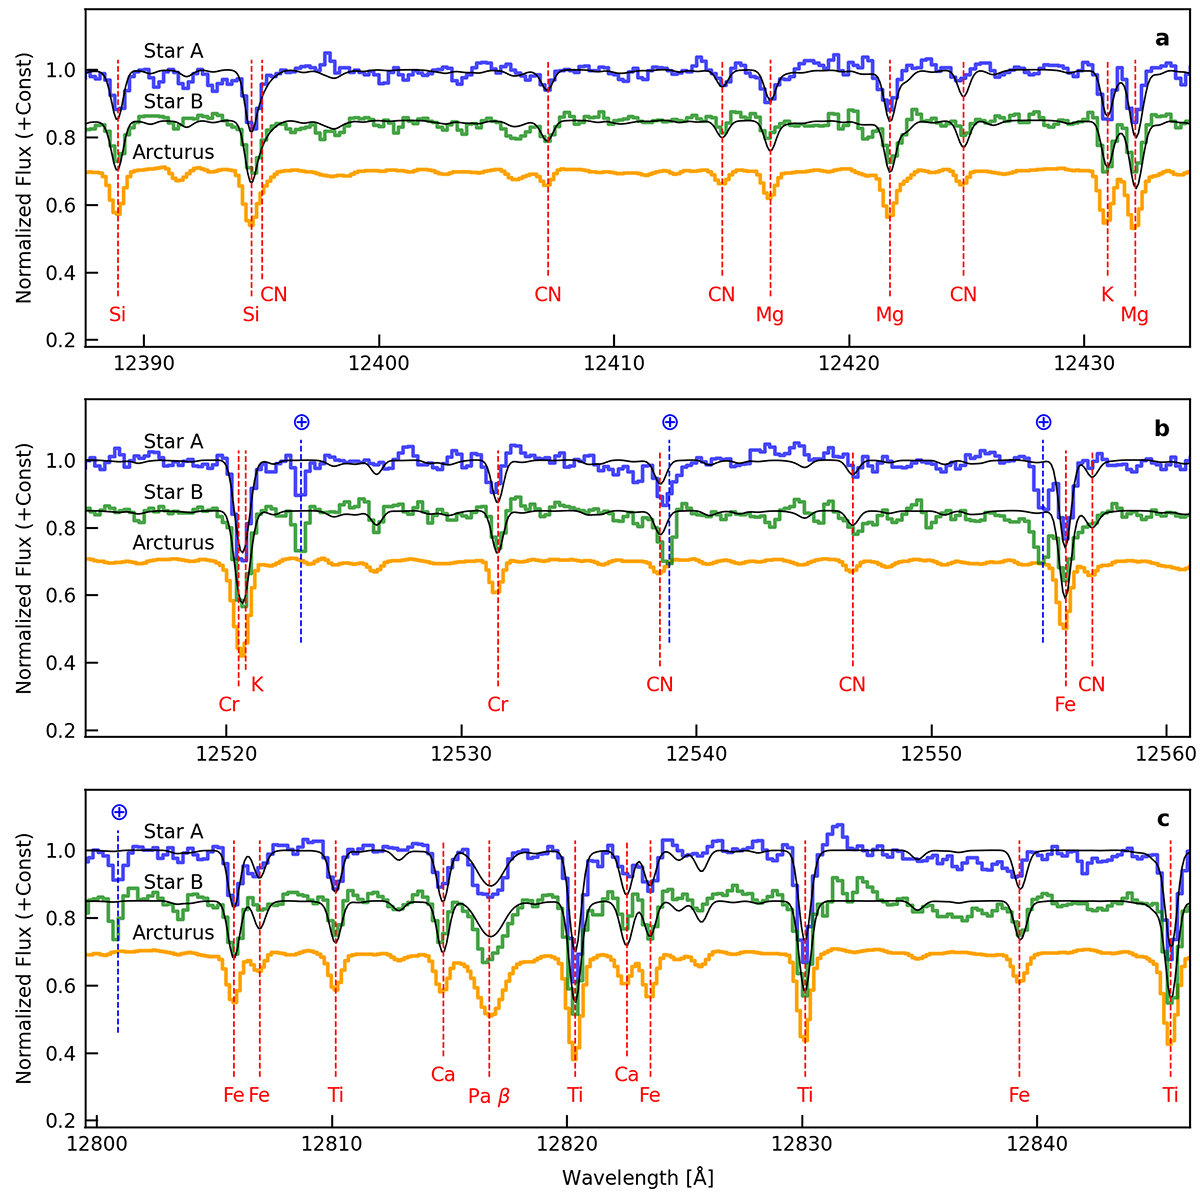
Fig. 3.
Download original image
Spectra for the two red giant members of the globular cluster VVV CL002. Star A (VIRAC2 ID=9327562027332) is shown in blue and star B (VIRAC2 ID=9327562015390) in green. Three representative parts containing absorption lines used for abundance measurements (Mg, Si, and Fe) and other lines are presented together with model spectra synthesized with Teff = 4100 K, log g = 1.5, and [Fe/H] = −0.54 (black). The spectrum of Arcturus (orange) is also shown for comparison, shifted to the appropriate velocity to match the spectra of the target stars. Arcturus (Teff = 4280 K, [Mg/H] = −0.2, [Si/H] = −0.2, [Fe/H] = −0.5) is a prototype red giant observed with the same setup (Fukue et al. 2021). We note that all the spectra appear very similar to each other. Absorption lines marked ⊕ are telluric lines, which are only seen in the two target stars but not in Arcturus for which a telluric correction was performed.
Current usage metrics show cumulative count of Article Views (full-text article views including HTML views, PDF and ePub downloads, according to the available data) and Abstracts Views on Vision4Press platform.
Data correspond to usage on the plateform after 2015. The current usage metrics is available 48-96 hours after online publication and is updated daily on week days.
Initial download of the metrics may take a while.