Fig. 2.
Download original image
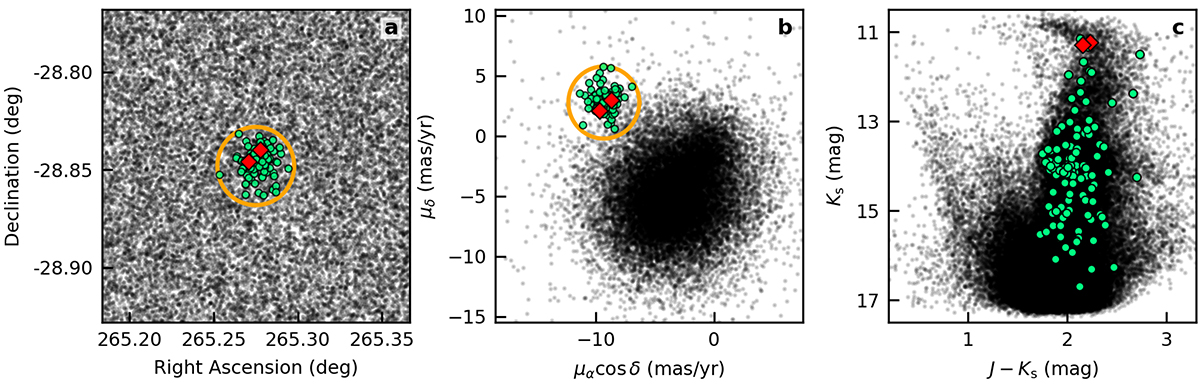
Illustration of the target selection from VVV CL002. Panel a: field surrounding the cluster, panel b: proper motion diagram. Panel c: NIR colour–magnitude diagram. The field stars are plotted with the black points, while stars located inside the selection circles (orange) in panels a and b are indicated by green circles. Some of these stars in green were selected as spectroscopic targets based on panel c, and we observed the two red giants indicated by red diamonds.
Current usage metrics show cumulative count of Article Views (full-text article views including HTML views, PDF and ePub downloads, according to the available data) and Abstracts Views on Vision4Press platform.
Data correspond to usage on the plateform after 2015. The current usage metrics is available 48-96 hours after online publication and is updated daily on week days.
Initial download of the metrics may take a while.