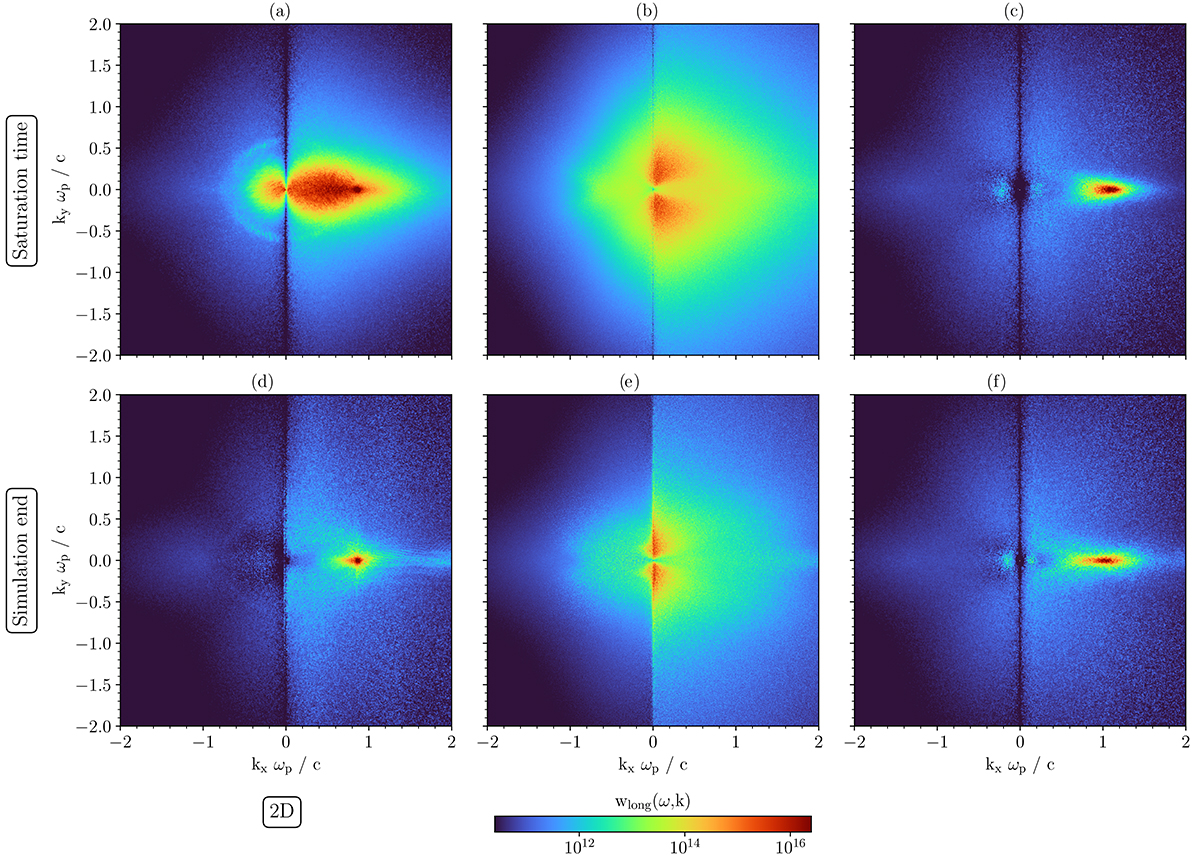
Fig. 6.
Download original image
Energy density of longitudinal electrostatic waves of 2D simulations in the wave vector space during the saturation time intervals (top row) and at the simulation ends (bottom row). All analyzed intervals are ωpta = 1000 long. The comparison between rows shows that the longitudinal electrostatic waves close to |k| = 0 decrease in time. (a) S1–2D : ωpt = 2000 − 3000. (b) S2–2D : ωpt = 1000 − 2000. (c) S3–2D : ωpt = 3000 − 4000. (d) S1–2D : ωpt = 9000 − 10 000. (e) S2–2D : ωpt = 9000 − 10 000. (f) S3–2D : ωpt = 9000 − 10 000.
Current usage metrics show cumulative count of Article Views (full-text article views including HTML views, PDF and ePub downloads, according to the available data) and Abstracts Views on Vision4Press platform.
Data correspond to usage on the plateform after 2015. The current usage metrics is available 48-96 hours after online publication and is updated daily on week days.
Initial download of the metrics may take a while.