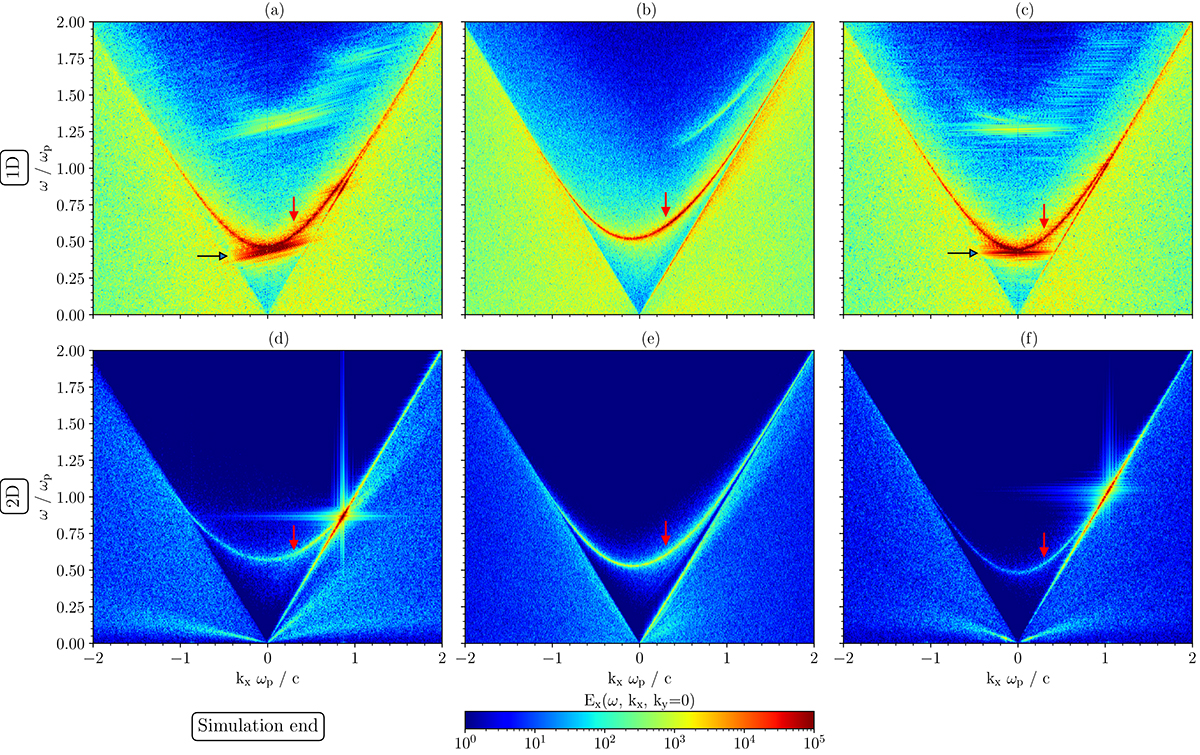
Fig. 3.
Download original image
Same as Fig. 2 but at the end of simulations in a time interval ωpt = 9000 − 10 000. Solitons do not appear in simulations (b) and (d)–(f). While the most intensive waves in 1D are the solitons and superluminal L-mode waves close to k∥ ≈ 0, in 2D, the most intensive waves are close to the light line, and solitons are not present. (a) S1–1D. (b) S2–1D. (c) S3–1D. (d) S1–2D. (e) S2–2D. (f) S3–2D.
Current usage metrics show cumulative count of Article Views (full-text article views including HTML views, PDF and ePub downloads, according to the available data) and Abstracts Views on Vision4Press platform.
Data correspond to usage on the plateform after 2015. The current usage metrics is available 48-96 hours after online publication and is updated daily on week days.
Initial download of the metrics may take a while.