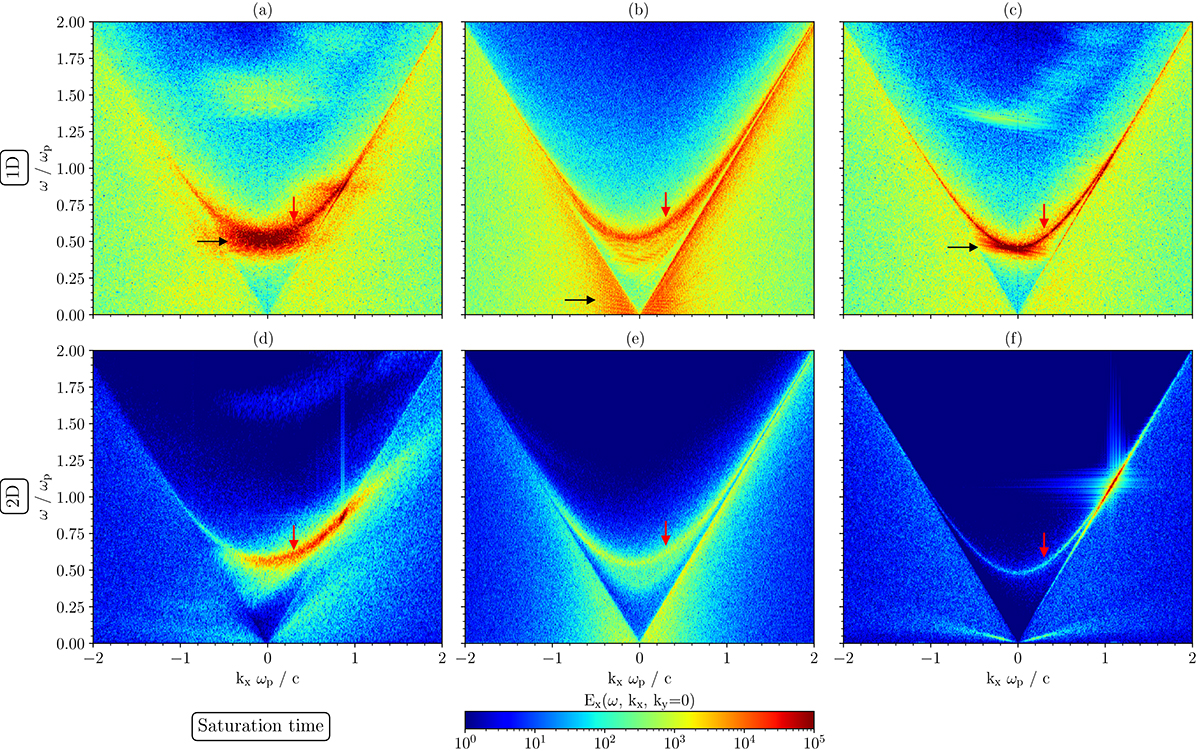
Fig. 2.
Download original image
Dispersion diagrams of the electrostatic waves along the magnetic field around the saturation time. Comparison between 1D (top row) and 2D (bottom row) simulations with the same plasma parameters. The solitons dispersion branches are denoted by black arrows and the superluminal L-mode waves by red arrows. The superluminal waves appear in 1D and 2D, while the soliton branch appears only in 1D. (a) S1–1D : ωpt = 1500 − 2500. (b) S2–1D : ωpt = 500 − 1500. (c) S3–1D : ωpt = 4000 − 5000. (d) S1–2D : ωpt = 2000 − 3000. (e) S2–2D : ωpt = 1000 − 2000. (f) S3–2D : ωpt = 3000 − 4000.
Current usage metrics show cumulative count of Article Views (full-text article views including HTML views, PDF and ePub downloads, according to the available data) and Abstracts Views on Vision4Press platform.
Data correspond to usage on the plateform after 2015. The current usage metrics is available 48-96 hours after online publication and is updated daily on week days.
Initial download of the metrics may take a while.