Open Access
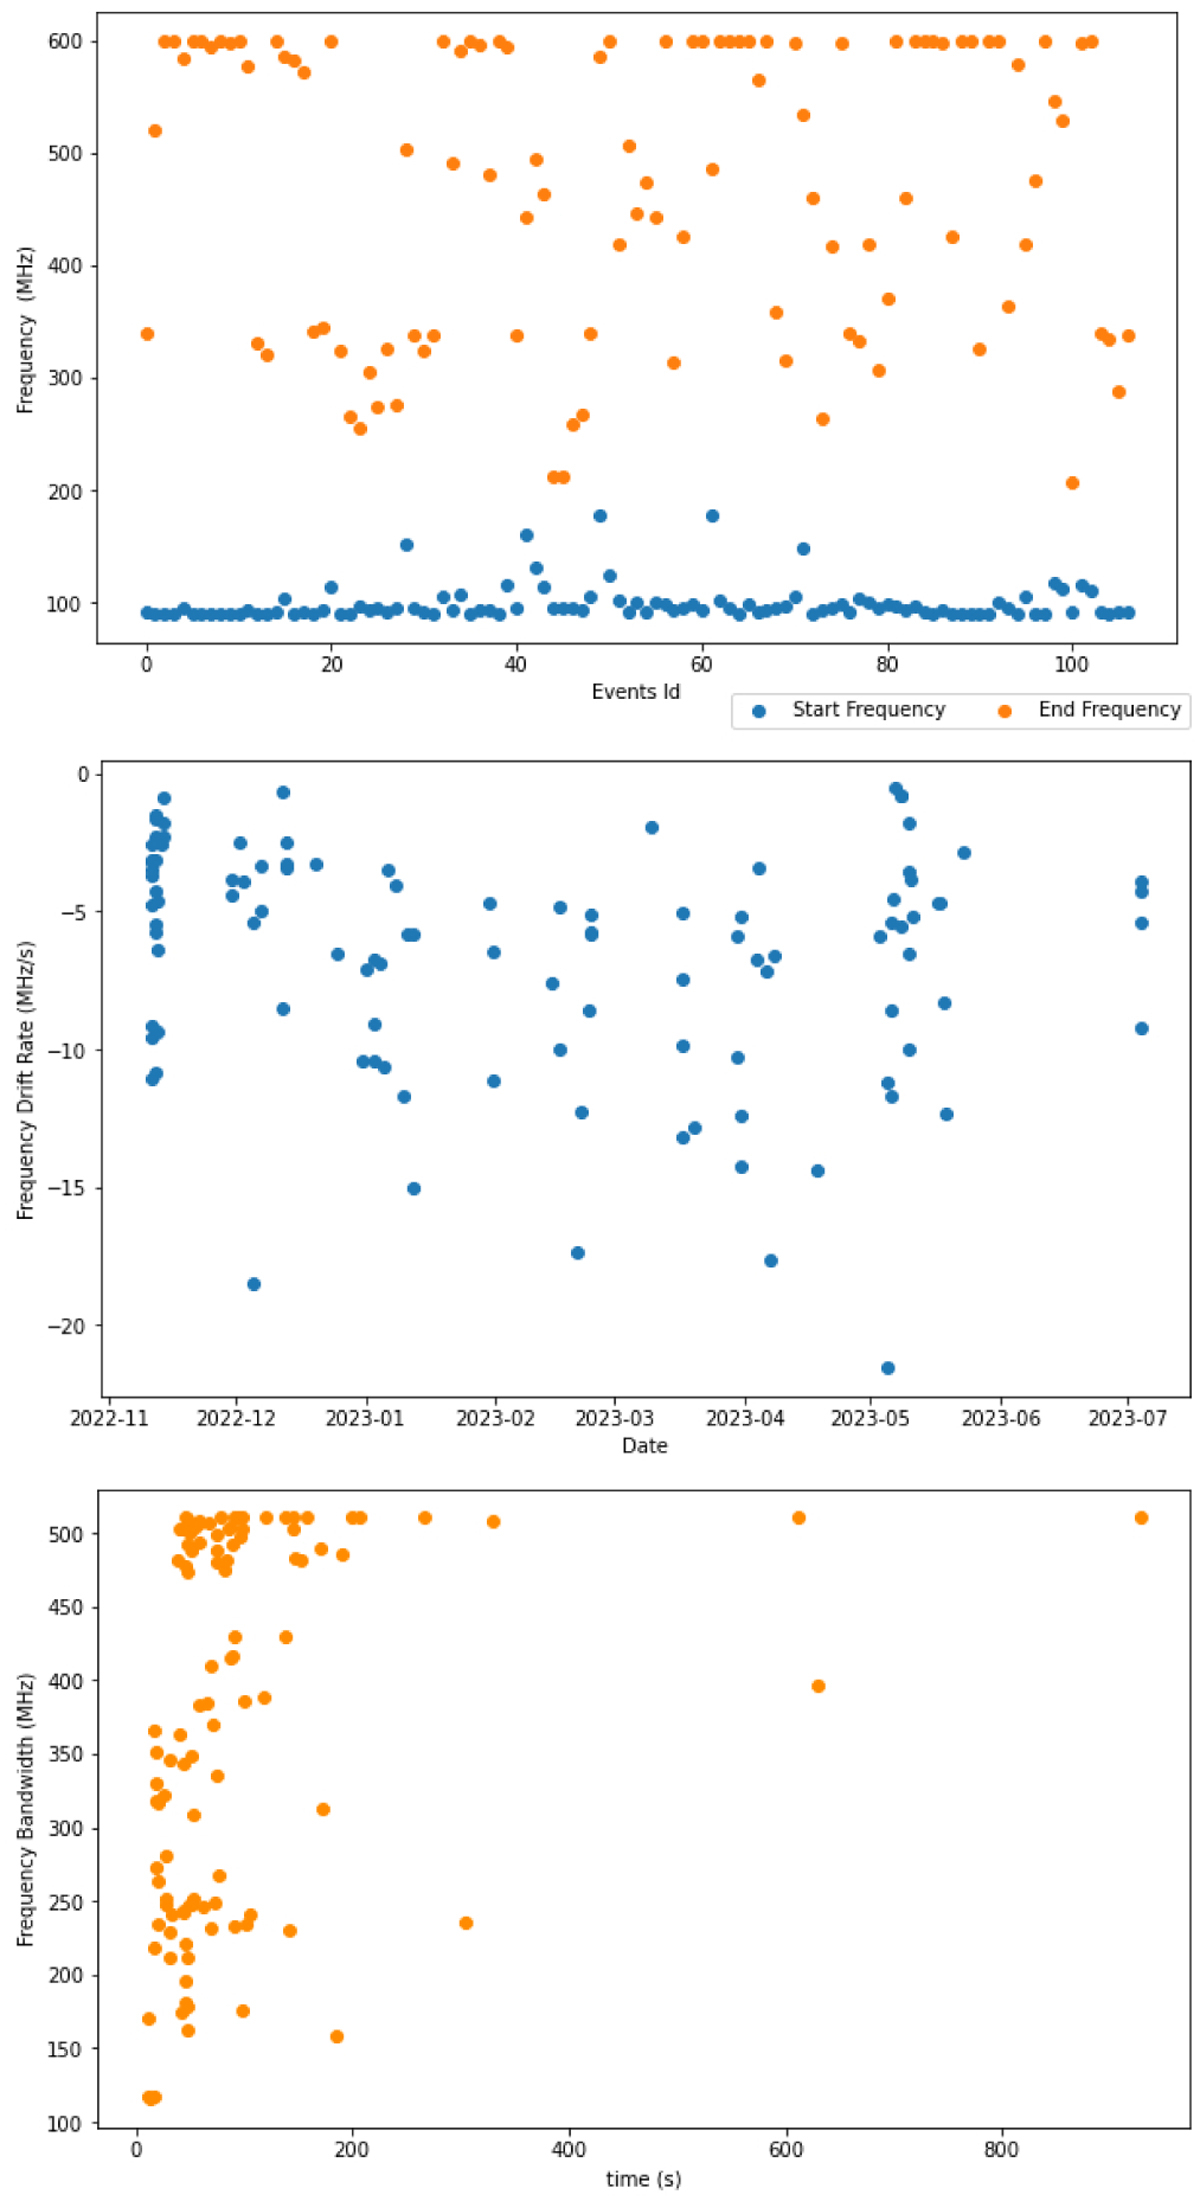
Fig. 9
Download original image
Analysis of type III SRB data. (a) Frequency chart depicting the starts and ends of events. (b) Statistics on the drift rate of the event date. (c) Distribution analysis of frequency bandwidth and duration for type III SRBs
Current usage metrics show cumulative count of Article Views (full-text article views including HTML views, PDF and ePub downloads, according to the available data) and Abstracts Views on Vision4Press platform.
Data correspond to usage on the plateform after 2015. The current usage metrics is available 48-96 hours after online publication and is updated daily on week days.
Initial download of the metrics may take a while.