Fig. 2
Download original image
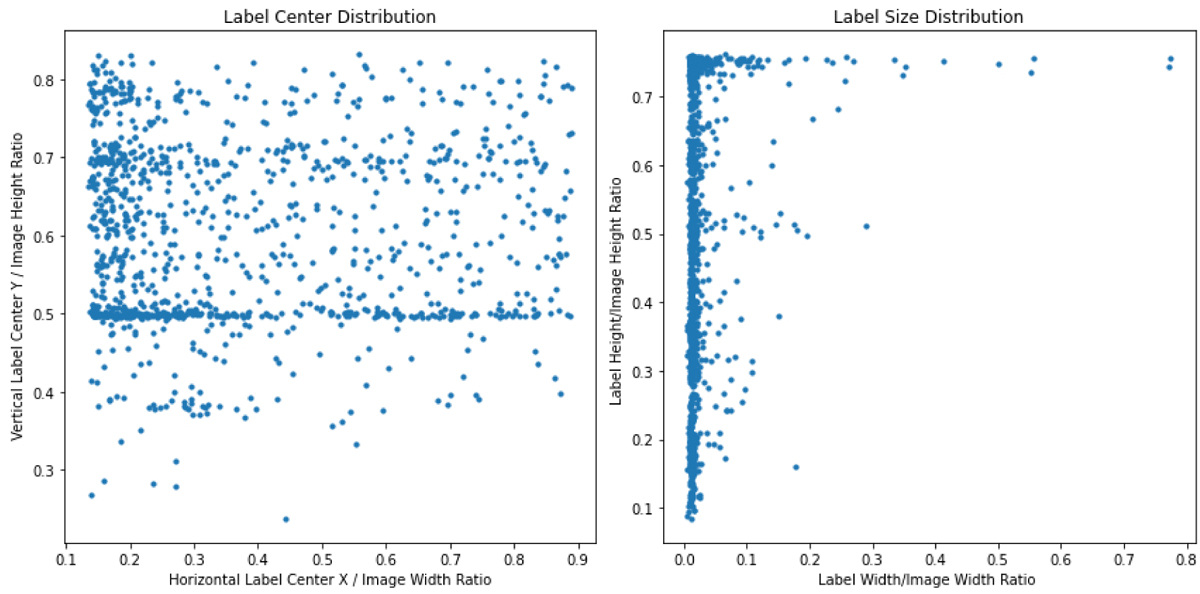
Images show the distribution of the labels. In the left graph, the horizontal x-axis represents the ratio of the horizontal coordinate of the label center to the image width, and the vertical y-axis represents the ratio of the vertical coordinate of the label center to the image height. In the graph on the right, the horizontal axis represents the ratio of label width to image width, whereas the vertical axis represents the ratio of label height to image height.
Current usage metrics show cumulative count of Article Views (full-text article views including HTML views, PDF and ePub downloads, according to the available data) and Abstracts Views on Vision4Press platform.
Data correspond to usage on the plateform after 2015. The current usage metrics is available 48-96 hours after online publication and is updated daily on week days.
Initial download of the metrics may take a while.