Fig. 4

Download original image
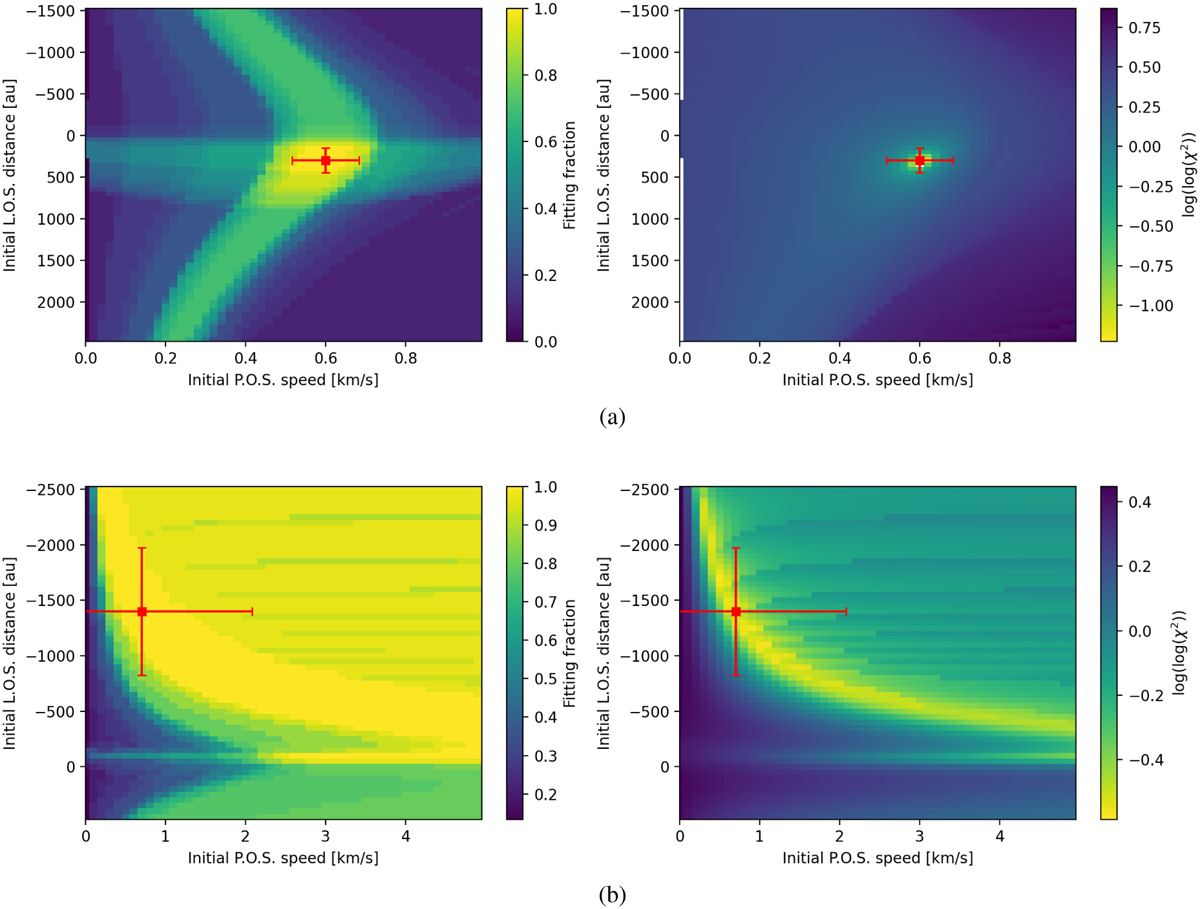
Distribution of goodness-of-fit estimates as functions of free parameters: initial speed on the POS (x-axis) and initial spatial offset in the LOS direction, for TIPSY fitting for S CrA (top panels) and HL Tau (bottom panels). Here, initial direction of gas in the POS (third free parameter) is fixed to the value for the best fit. Left panels: distribution of fractions of coordinate values of points in the observed streamer curve (intensity-weighted means and standard deviations), which is consistent with the theoretical trajectories. Right panels: distribution of log(log(χ2)) deviations between the observed streamer curve and theoretical trajectories. In all the plots, yellow regions represent good fits. Red squares represent the best fit, as discussed in Sect. 2.2. The red lines passing through them represent errors, as discussed in Sect. 2.3.
Current usage metrics show cumulative count of Article Views (full-text article views including HTML views, PDF and ePub downloads, according to the available data) and Abstracts Views on Vision4Press platform.
Data correspond to usage on the plateform after 2015. The current usage metrics is available 48-96 hours after online publication and is updated daily on week days.
Initial download of the metrics may take a while.


